
The purpose of performance measurement is to track how employees and their actions add value to an organization. For public companies, this value is typically reflected in shareholder returns and capital market valuations. But how can executives making operating decisions know how those decisions are going to be received by the market? If a new investment or acquisition adds $100 million in revenue, how will that affect the share price? What about $50 million in EBITDA (earnings before interest, tax, depreciation, and amortization) or free cash flow? And what impact will a cost-cutting initiative have if it improves operating margin by 3 percent?
The reality is that the answer to each of these questions depends on an array of factors. The cost-cutting initiative may end up reducing revenue or even EBITDA, resulting in a net negative share price reaction. Just as the acquisition that brings in $100 million in added revenue or $50 million in EBITDA may require so much capital that overall the transaction drives returns lower.
Regardless of whether companies use revenue, EBITDA, earnings per share (EPS), free cash flow, or return on capital as their key performance indicators, they will not have clear insight into the effects of management actions on shareholders. None of these metrics reliably relates to shareholder returns because each of them is incomplete. But there is a measure that reliably reflects shareholder returns and market valuation. It’s called economic profit (EP).
About EP
First conceived in the early 1900s, the notion of economic profit was developed to serve as a comprehensive performance indicator that balances growth, profitability, and rate of return. The most well-known iteration is economic value added (EVA), which was popularized in the 1990s by advisory firm Stern Stewart. Today EVA is advocated by the world’s largest proxy adviser, Institutional Shareholder Services (ISS), which signaled its embrace of the measure when it acquired EVA Dimensions in 2018.
Current users of economic-profit–based incentive compensation include Caterpillar, Deere & Company, Ball Corporation, 3M, CSX Corporation, AutoZone, and Elanco Animal Health, among many others. Sophisticated investors and analysts also use economic profit for valuation purposes.
Significant evidence links the use of economic profit to superior stock market performance. A recent study from the Journal of Applied Corporate Finance shows that companies using EP-based incentives outperformed their peers and the S&P 500 on total shareholder returns by an annualized average of 4.7 percent and 7.0 percent, respectively. The paper additionally features interviews with public company CEOs and CFOs on how economic profit helps align their teams on a shared goal of long-term value creation.
EP measures are reliable proxies for total shareholder return (TSR) because they send an unambiguous value creation signal that simplifies decision-making—no need for endless analyses of the new plant, product, or whatever investment management may be considering. As Ball Corporation’s CFO, Scott Morrison, described his organization’s use of EP in a 2021 webinar: “[I]t makes the meetings shorter … [and] takes away a lot of the [negotiation] that happens in the budgeting process.”
Fortuna’s EVA Alternative
As part of the 2024 Fortuna Advisors Value Leadership Report, released in January, we performed our own assessment of how measures that are often linked to executive compensation relate to outperformance in total shareholder return over the past five years. This research indicates that a modern version of economic profit, developed by Fortuna, is a better proxy for shareholder returns than any of the other common performance measures we see in public company proxies.
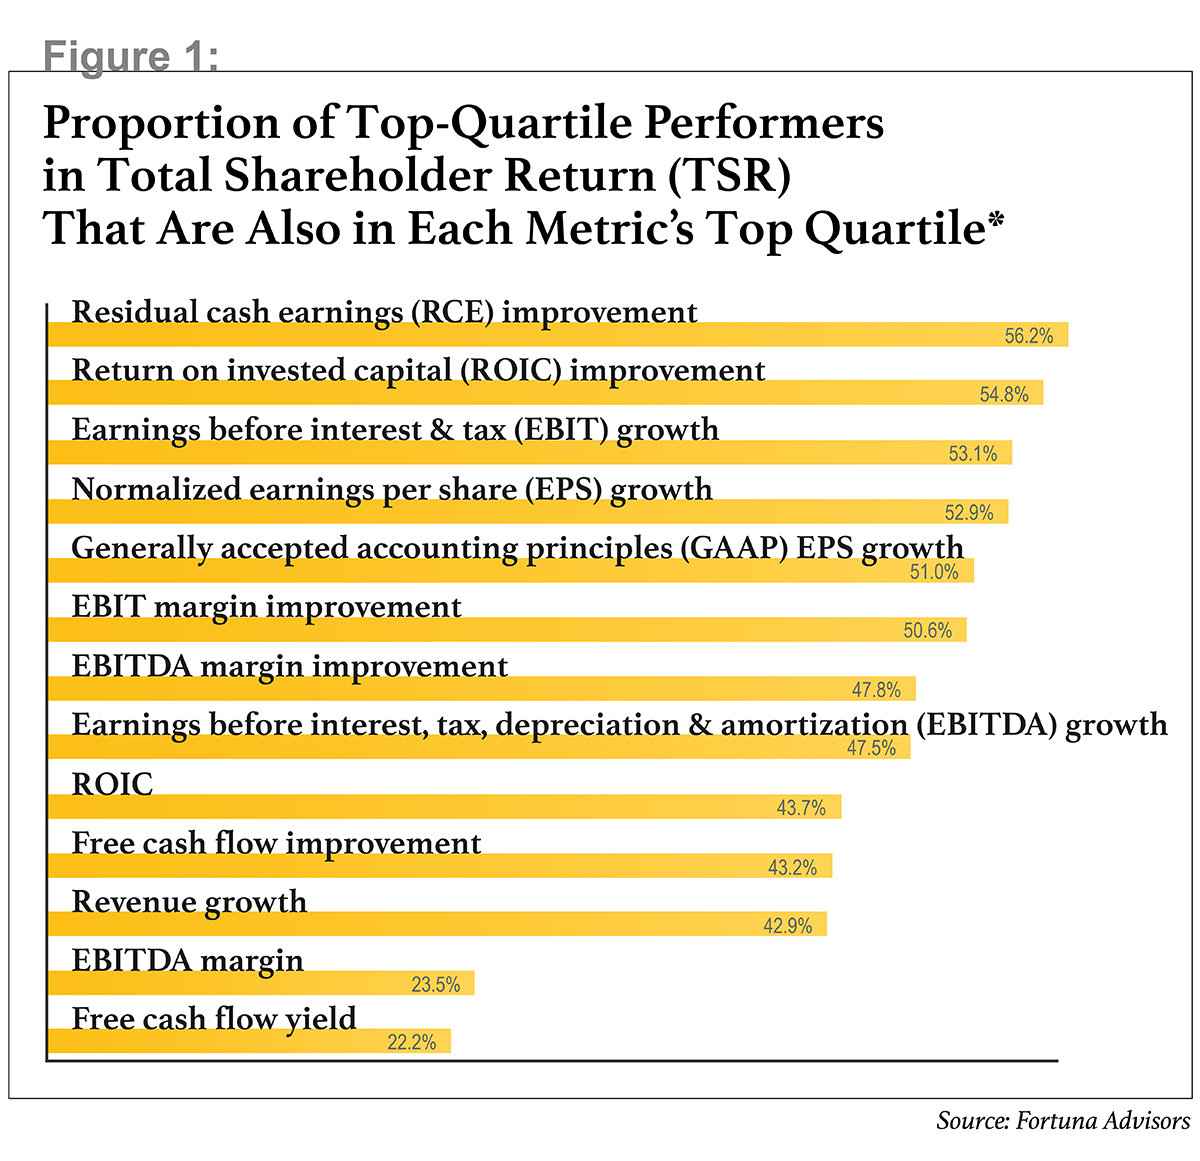
After spending years implementing Stern Stewart’s EVA and applying Credit Suisse HOLT’s cash flow return on investment (CFROI), partners at Fortuna created a new measure of economic profit called residual cash earnings (RCE). Whereas EVA and CFROI are fairly complex, and EVA has been found to discourage investment in long-term growth, RCE provides a reliable and easy-to-understand value signal. To put it simply: Up is good, and down is bad. And, most important, it shows a stronger relationship to TSR than does EVA or generic EP (see Figure 1).
For the past three years, we have run the same analysis over rolling five-year periods, and it’s interesting to note the shifting trends. In the period ending in 2021, we observed a strong investor preference for revenue growth and EBITDA. In 2022, as inflation and interest rate hikes came into focus, investors pivoted to stocks with higher returns on invested capital (ROIC). Despite a substantial return to riskier assets and industries in 2023, investors continued to embrace stocks with high ROIC and earnings over those with high revenue growth. The higher cost of capital, resulting from higher interest rates, seems to have kept investors focused on capital productivity and profitability over growth.
Still, across all three years, RCE correlated with total shareholder return more closely than did any other measure, including revenue growth and ROIC. This demonstrates RCE’s ability to guide performance, even across market cycles and shifting investor trends. Just as important, as Figure 2 indicates, RCE is versatile in predicting shareholder returns across industries. While traditional EP has been criticized as applying only to “old world” companies with tangible assets, RCE captures intangible assets as well, as shown by its effectiveness in predicting total shareholder return for industries such as software and pharmaceuticals.

How to Build a Value-Based Management Program Around EP
The value of economic profit to corporate leaders is that its simplicity and directional insights make it an effective north star for management decision-making. There are two primary areas where this comes into play: resource allocation and executive compensation.
1. Support better capital allocation decisions.
When corporate managers are deciding where to invest the company’s capital, EP illuminates the most value-accretive strategies, whether mergers and acquisitions (M&A) or optimal working capital arrangements. EP metrics can even provide insight into the optimal allocation of capital or other resources across a portfolio of products, regions, or disparate business units.
While many management teams speak to the importance of “agile capital allocation,” most corporate efforts are mired in exhaustive analyses of tradeoffs using incomplete measures. The ability to quickly reallocate resources requires a decisive measure that provides a comparable (apples-to-apples) analysis, from the consolidated level down to the SKU.
Agile resource allocation also requires a real-time analytics platform that enables teams to seamlessly drill down into businesses’ EP profiles, to any desired level of granularity, as economic conditions change. Such fact bases enable executives and finance teams to stay on top of value creation trends across the corporate portfolio, transforming resource allocation from a headache-inducing and resource-intensive annual or multiyear exercise into a regular and repeatable process. The result is proactive, rather than reactive, resource allocation. Companies can create these platforms in-house, but some packaged software solutions provide this functionality as well, saving management teams from reinventing the wheel.
Because quality financial data is crucial for accurately assessing economic profitability, finance teams should carefully consider how the business is organized, which data they need to track, and at what level they need to track it. To complicate the matter, many of today’s corporate portfolios span not only a multitude of products and services, but also disparate business units and geographies. While many companies have a good sense of the P&L impact at granular levels down to gross profit, or even EBITDA, our experience has been that few have the balance sheet allocated down to the product or customer, which is essential for assessing economic profit at that level. As a result, complex portfolios often require cross-allocating shared costs and assets to get the full economic picture for each unit being analyzed, whether it is a product, region, or operating segment.
There are many ways to allocate balance sheet items, and what’s right for one business may not be right for another. Keep in mind that the organization’s structure, which drives today’s allocation frameworks, may change in the future. So the finance team may have to consider different methods and test the outcomes.
The outputs of this process will eventually lay the foundation for management’s long-term strategic thinking, so it’s essential to get them right. In addition, regional or business unit leaders may feel that they can influence the allocation of shared capital or expenses to improve their profitability or secure more resources, which can lead to disagreement. These issues drive some companies to turn to outside advisers for their perspectives on cost allocations. A firm with experience allocating costs can mitigate any potential bias and ensure more accurate results.
The beauty of an EP-based framework is that it provides an objective view of performance, which removes the likelihood of favoritism and makes budgeting and planning more straightforward. And when EP is tied to management’s incentives, business unit leaders are likely to request more capital only if they’re confident they can earn an adequate return on it, as EP considers not only growth and profitability, but capital productivity as well. The result is more accountability, less negotiation, and ultimately a more efficient allocation of resources.
2. Build incentives that will drive better behaviors.
The second area in which EP is a game-changer is corporate behaviors and company culture. Most leaders are inclined to do the right thing for their companies and shareholders, but incentives have an undeniable influence on how the business is run. We see this play out to the detriment of shareholders in a few ways.
EBITDA, one of the most common performance measures in company proxy statements, is a prime example. Given its popularity, some may be surprised to learn that growing EBITDA is not always a good thing. As an absolute earnings measure, EBITDA fails to divulge the level of capital needed to produce each dollar of earnings, so an action that looks good in EBITDA terms may lead to poor returns on capital.
Consider a sales team that offers price concessions, driving sales and EBITDA higher but eroding margins. Or consider a situation where relaxing payment terms with the goal of growing volume leads to less efficient working capital and lower returns on assets. These are subtle but important examples of ways in which EBITDA can unintentionally promote adverse behaviors.
The biggest challenge with EBITDA may be the way in which it motivates value-destructive M&A. When incentive compensation is linked to EBITDA, companies often pursue overpriced acquisitions to boost their earnings profile, with little regard to covering the cost of capital on the transactions. In management circles, this practice has become known as “buying EBITDA.” The examples of overpriced acquisitions are abundant—and have often been disastrous for shareholders of the acquiring entities.
One good example is the case of healthcare technology company Teladoc, which announced the completion of an $18.5 billion acquisition of competitor Livongo on October 30, 2020. Over the following 12 months, shareholders in the company saw the value of their investment fall 24 percent, even as the SPY ETF, which tracks the S&P 500, yielded a whopping 43 percent total shareholder return. Of course, acquisitions take time to integrate, so you may be wondering how the acquisition looked after two years. Over the 24 months following the transaction, Teladoc saw an annualized TSR of -61 percent (vs. +11 percent for SPY), further compounding shareholders’ woes. In February of 2023, Teladoc ultimately reported, in its Q4/2022 earnings call, a non-cash goodwill impairment charge related to its acquisition of Livongo of $13.4 billion—a stunning 72 percent of the purchase price.
Another classic example of adverse incentives occurs when companies prioritize share repurchases over lucrative internal investment opportunities, in order to lower share count and provide an artificial boost to earnings per share. Opportunity costs notwithstanding, this leads to diminished earnings over the long term. But it is a common occurrence when executive incentives revolve around EPS.
Alternatively, companies with a top-line focus often suffer from a growth-at-all-costs mentality. And management teams whose incentives are based on return on capital or return on assets tend to sacrifice plenty of healthy, value-accretive investments and opt to fund only exceedingly high-return projects. Not only does this leave substantial shareholder value on the table, but the chronic underinvestment in new products, technologies, and services makes it increasingly difficult for these firms to keep pace with peers and maintain market share.
Correcting such behaviors requires incentives to be tied to a metric that consistently moves directionally with the company’s stock price so that it can’t be gamed. The solution is a complete measure, with strong linkage to shareholder returns, which can eliminate the agency problem posed by traditional incentives and compensation practices. Economic profit measures offer an excellent alternative to the metrics that commonly drive behaviors which undermine TSR.
Just as important, EP promotes a culture of continuous improvement, because EP targets are ideally set based on prior-year performance, a practice that would be problematic for most common performance measures. Thus, management teams are motivated to sustain performance improvements over time. Teams no longer waste resources on time-consuming and counterproductive negotiations around target-setting for budgets and plans. To boot, plans and budgets become more accurate, as management no longer has an incentive to hold back information and sandbag budgets in hopes of setting a more readily achievable target.
Ultimately, using EP leads to more accountability for results, less time spent on negotiations, and more time spent creating value. Alignment on a shared goal of continued value creation forges better behaviors and, in turn, a sustainable competitive advantage for shareholders and management alike.
Learn more about RCE, how it’s calculated, and how it differs from EVA and traditional EP here.
Michael Chew (mi**********@**************rs.com) is manager of thought leadership at Fortuna Advisors. His recent publications include “Driving Outperformance: The Power and Potential of Economic Profit” (Journal of Applied Corporate Finance), the “2024 Fortuna Advisors Value Leadership Report,” and the “2024 Fortuna Advisors Buyback ROI Report.” Those interested in learning more about EP-based incentives and resource allocation are encouraged to reach out.
Chris Moore (ch*********@**************rs.com) is a vice president at Fortuna Advisors. His previous publications include the “2024 Fortuna Advisors Value Leadership Report” and the “2024 Fortuna Advisors Buyback ROI Report.” Moore has supported clients in the energy, distribution and logistics, aerospace and defense, and gaming industries integrating RCE into strategic and operational frameworks, and incentive compensation design.
