
Though much has been written about the need for dynamic strategic planning,[i] corporate boards and management teams should also consider how their approach to capital allocation needs to evolve and adapt to such conditions, given its critical role in creating value. Yet, in our advisory work we see potent obstacles to effective capital allocation that are being exacerbated by today’s environment
First is the managerial inertia that stands in the way of actively reallocating capital toward higher potential opportunities and away from businesses with declining prospects.[ii] Second, GAAP’s definition of “capital” excludes—and thus should be expanded to take in—intangible assets like R&D projects and brands. Adding to these barriers are headwinds that include higher inflation and interest rates, shifting consumer behavior, reconfiguring supply chains, and labor market stresses.
The management challenges faced during tough times distinguish winners from losers more decisively than the rising tide of favorable macroeconomics that buoyed many companies during most of the past decade. The starkness of this divide shows up clearly in the dispersion of total shareholder returns (TSR) among S&P 500 companies during the past 4 years. From 2019 through 2022, the spread between top and bottom quartile performers increased by over 6 percentage points.[iii] How companies allocate resources, particularly how well they measure value, assess operating performance, and reward managers, contributes greatly to these differences in TSR.
As discussed extensively in articles and roundtables that have appeared in this journal (including this issue), one promising place to look for a better value management approach is residual income or economic profit—“EP” for short. We analyzed the performance of companies that use some version of EP to evaluate results and determine incentive pay, and then conducted interviews with several of their senior executives.
Why do more than 30 public companies deploy such plans? The most basic explanation, as offered by Worthington Industries’ CFO Joseph Hayek, is that
We adopted EVA to widen our aperture for making decisions, to increase consideration of balance sheet costs and asset intensity. If metrics are too P&L-focused, you can get into situations where you generate strong accounting profits but poor cash returns.
But there is more to the success of EP companies than making up for GAAP accounting’s inability to distinguish between earnings and recurring cash flow, or helping corporate managers account for the cost of capital in their operating and investment decisions. Today perhaps more than ever, business leaders need to rethink how they balance growth, margins, and capital productivity. As we’ve seen over the past three decades, economic profit has been used by many successful companies to help people at all levels of their organizations evaluate these tradeoffs.
And our own research on companies that use EP in executive compensation confirms its power to enable superior financial performance while identifying useful implementation lessons and highlighting ways to improve current methods. Kimball Electronics CFO Jana Croom summarized the opportunity well when she said,
EP strongly influences investment behavior at Kimball Electronics. People realize there’s no free lunch. I’ve seen other companies that don’t have a capital charge experience “capital creep.”
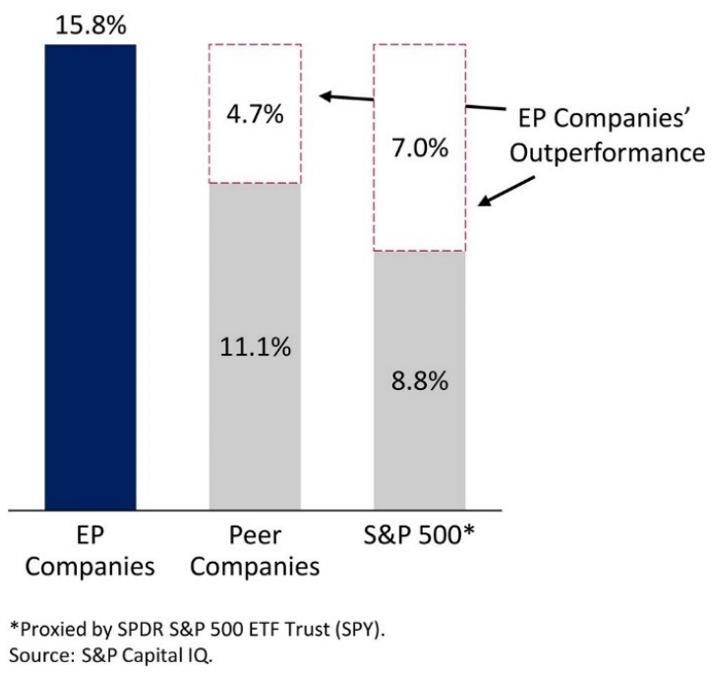
When we examined the 32 public companies that use an EP metric in their executive compensation design, we found, first of all, that they range in size from less than a billion dollars in market capitalization to over $100 billion. And as can be seen in Exhibit 1, they represent many industries, including consumer products, industrials, oil and gas, and life sciences. As shown in Exhibit 2, the EP companies outperformed their peers on annualized TSR by an average of 4.7% percentage points over the time period we studied each company,[iv] while beating the S&P 500 by 7.0%. What’s more, their EBITDA margins were 3% higher, and their associated increases in EBITDA margin were 0.8% larger.
EXHIBIT 1 Companies Using Economic Profit Incentives
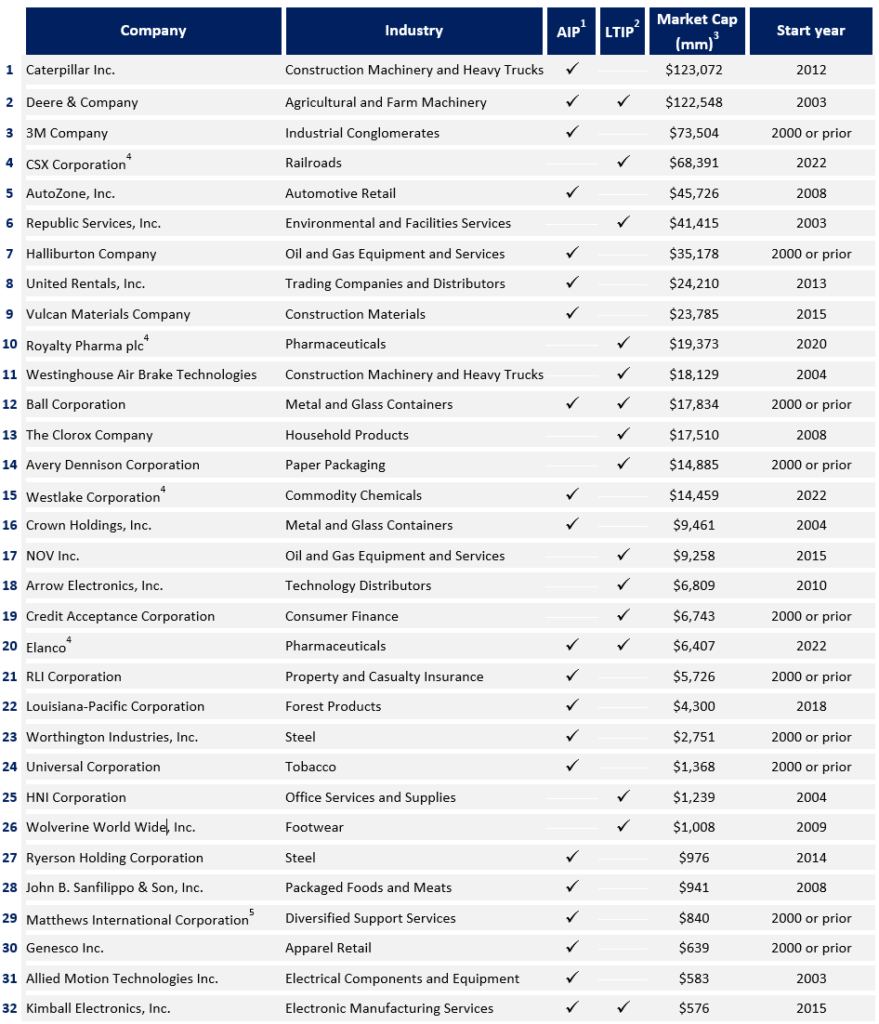
1 Annual Incentive Plan, the component of incentive compensation focused on the current year.
2 Long-Term Incentive Plan, the component of incentive compensation typically focused on the next 2 to 3 years.
3 Market Cap as of November 18, 2022.
4 Excluded from analysis as the company has only recently implemented EP and does not yet have significant data.
5 Excluded from analysis due to lack of Quick Comps available on S&P Capital IQ.
Source: S&P Capital IQ.
At the same time, however, the EP companies had lower revenue growth and a higher average ratio of assets-to-sales—or asset-intensity. This underperformance on asset intensity, though unexpected, was reassuring in one sense. Critics of EP argue that putting a charge on capital leads inevitably to cuts in the amount of capital employed and hence in total assets. But our research suggests that EP companies are not afraid to put capital to work, as long as they have sufficient margins to cover the capital costs.
As for the lower growth of EP companies, this finding reinforces a long-standing criticism of the prevailing version of EP—the one that depreciates fixed assets and is used by almost every company in our study.[v] Defined as NOPAT minus the capital charge, the use of this simple version of economic profit can, as critics argue, discourage managers from making new investments because they seem more expensive than old assets. As Worthington’s CFO Hayek has put it, “EVA loves old assets.” But, as he goes on say, “it’s important to look beyond depreciated assets and measure the value of the next dollar invested.” How to encourage and enable corporate managers to accomplish this is one of the main recommendations in what follows.
EXHIBIT 2 EP Companies’ Total Shareholder Return versus Peers and S&P 500*
The Case for Economic Profit
Skeptics tend to dismiss EP as “just another performance measure” without recognizing how it can function as the centerpiece of a coherent financial management system that gives rise to owner-like corporate thinking and decision-making. Given EP’s more direct and stronger link than EPS to intrinsic and market values, company-wide adoption generally leads to better results and an investor-oriented culture, while contributing to a sense of accountability that extends over multiple time periods.
At Worthington Industries as in most of the companies whose senior execs we interviewed, EP is embedded within and used to guide an interrelated set of processes, from planning and resource allocation to performance management, including the design of employee and executive rewards. EVA reinforces the main tenets of the Worthington Business System, a disciplined management philosophy that emphasizes continuous innovation and transformation, selective acquisitions, and value-increasing investments in technology and sustainability.
As we discuss below, the EP companies provide several practical lessons for successfully implementing EP to increase the long-run efficiency and value of businesses:
- Improve investment decisions by discouraging value-reducing investment and rewarding value-increasing investment.
- Establish a common language for value creation throughout the organization.
- Encourage an ownership mentality.
- Enable cultural transformation.
- Align internal measurement with outside-in perspectives to facilitate more meaningful dialogue with investors.
The fundamental reason to employ EP was best laid out by professors Michael Jensen and William Meckling, who once described EVA in this journal as “…the best flow measure of performance currently known.”[vi] EVA, like all measures of EP, incorporates the opportunity costs of capital, which, though largely ignored by P&L-focused financial analysis, are reflected in market valuations. Accounting profit measures, like net income, EBIT and EBITDA, are incomplete because they compare inflows only with explicit costs. When managers aren’t “charged” for their use of capital they tend to treat it as free and use too much. To counteract this incentive, companies put in place tight controls on capital spending that have the unwanted effect of reducing entrepreneurial thinking, innovation, dynamic course changes, and, perhaps worst of all, accountability. In the words of Bennett Stewart, one of the leading implementers of EP, “In most companies, capital is free so it has to be tightly controlled. With [EP], capital is expensive so we can make it more freely available.”
As we learned when talking with Caterpillar CFO Andrew Bonfield, the company has been using their version of EP (OPACC) enterprise-wide since 2017 to provide “the discipline” to keep from “overexpanding as much during boom times. And it’s helped us become leaner and more capital efficient.” When capital costs are made explicit, it’s easier for operating managers to make the trade-offs between capital productivity and margins that often arise. With the guidance of an EP-based performance management system, managers learn that it’s still acceptable to pursue low-margin activities, such as services and support, if they don’t require much capital. They are also encouraged to continue capital-intensive activities like manufacturing, provided the margins are high enough to cover the capital costs.
In sum, EP’s ability to inform and bring discipline to corporate decision-making across the growth spectrum makes it well-suited for evaluation—and once decisions are made, after-the-fact monitoring—of investments with very different capital intensities or business models.
Productive Working Capital. EP also helps managers think more strategically about the use of working capital as a deliberate investment intended to create value in its own right—as opposed to just another a cost to be minimized. Such an EP focus informed the decision by Kimball Electronics during the Covid pandemic to strengthen customer relationships by building extra inventory to mitigate their potential parts shortages. As Kimball’s CFO Jana Croom explained this decision, “Customers are more than welcome to use our balance sheet, provided they are willing to pay for it.”
Employing several partial, and often conflicting, performance measures within the same organization often leads to a confusion of mission and motives. For example, when revenue, operating profit, and free cash flow (FCF) are all used to evaluate various projects, different corporate functions understandably emphasize the measure of greatest relevance to them. Sales and marketing people are likely to care most about revenue, while business unit management focuses on operating profit, and the finance team on FCF since the measure will determine the company’s new capital requirements. And when the inevitable conflicts that are aggravated by these partial measures come into the open, the typical outcome is protracted, debate-filled meetings that end up producing decisions that leave all parties dissatisfied and puzzled.
The use of a single overarching measure, by contrast, tends to bring about convergence far more quickly and predictably. As CFO of Ball Corporation Scott Morrison said during a 2021 webinar, corporate meetings are “shorter because we are really focused on economic profit.”
CEO Jeff Sanfilippo of John B. Sanfilippo & Son makes much the same point when he says, “everything we communicate is tied back to EP. We talk about it in every meeting.” Encouraging the use of EP throughout the company for resource allocation decisions creates a shared view of how value is created, which in turn helps align people’s motives. But as Sanfilippo makes clear, realizing these cultural benefits requires consistent support from senior management and a commitment to setting the expectation that every major investment and operating decision be designed to increase the company’s EP.
When employees take on an ownership mindset, they can be expected to make proactive decisions and help identify customers and investment opportunities that increase longer run as well as near-term value. The accountability that EP provides helps build trust within the management team and facilitates decision-making by limiting the opportunities for “gaming” that proliferate in the presence of multiple and incomplete measures, and when there is too heavy a reliance on forecasts and target negotiations.
Sanfilippo provides a compelling description of such a collaborative environment, and of the benefits that can be expected from decentralizing authority, when he says:
EP has driven enormous changes in the organization. It’s gotten every function to work together. … With EP everyone now understands our strategy and executes toward common goals. Our culture has evolved from one of command and control to one of empowerment, particularly of department leaders.
Echoing this sentiment, CEO Don Charron of Kimball Electronics describes his employees as having “the right and the responsibility to speak up during a program review if the plan is not believable. They act like the budget dollars in question are their own money.” Or, as Worthington’s Joe Hayek summarized, “Our EVA-centric mindset reinforces an ownership culture.”
Upgrading the Dialog with Shareholders. Executives who consider adopting EP often express doubt about whether their investors will understand and accept the measure. In our experience, both investors and proxy advisory firms respond with enthusiasm to announcements of EP, especially when implemented properly. As Kimball Electronics’ CFO, Jana Croom, put it, “Our investors see EP as a differentiator. Value shareholders love it.” When Varian Medical Systems released its first proxy introducing the measure, their new evaluation and reward program was applauded by Institutional Shareholder Services (ISS) and many of Varian’s investors.[vii] This response is consistent with our finding, reported earlier in Exhibit 2, that the annual shareholder returns of EP companies outperformed their peers by almost 500 basis points.
Study Methodology
To identify companies currently using EP metrics in performance measurement and incentive compensation, we searched proxy statements in the S&P Capital IQ database for keywords such as “economic profit,” “Economic Value Added,” “capital charge,” “cost of capital,” “WACC,” and “risk-adjusted ROIC.” We then reviewed individual proxy statements, confirming the use of EP measures, and eliminated companies with less than four years of history, or with limited peers available in S&P Capital IQ. Our sample yielded 27 companies and their associated peers, which were selected based on S&P Capital IQ Quick Comps.
We then used financial and market data from S&P Capital IQ to calculate five performance metrics for each company: Total Shareholder Return (TSR), EBITDA margin, change in EBITDA margin, revenue growth, and Asset Intensity, a proprietary measure of asset efficiency. Measures were calculated for the years in which the company used an EP metric from 2000-2021.
For each measure, we calculated the differential for each company versus its peers over the relevant period. We then determined the median, mean, and weighted average of the resulting differentials. The weighted averages factor the actual number of years each company used an EP metric.
EP 2.0: Improving Common Practices to Encourage Value Creation
As noted earlier, EP can be especially valuable for companies seeking to find the optimal balance of growth and efficiency—or what might be thought of as quantity (think revenue and EBITDA) versus quality (ROIC)—by using a single, comprehensive measure of value creation. More traditional versions of EP—let’s call them EP 1.0—turn out to have drawbacks, such as complexity and an excessive front-loading of investment costs—that may well have contributed to the lower revenue growth of EP companies reported earlier. And analysis from Steve O’Byrne provides further support by showing the ability of EVA improvement to explain returns doubled when
the capital charge was deferred to match the “delayed productivity” of capital.[viii] All these findings motivated us to modify the EP measure to reduce its unintended penalty for investing in long-term profitable growth.
Several executives we interviewed voiced concern about underinvesting and emphasized the importance of balancing near-term results with future growth. As one CEO told us, “There have been times in the past when people were reluctant to spend capital on viable long-term growth opportunities so that current year’s bonuses wouldn’t be reduced.” And one CFO observed a similar challenge with managing working capital, noting that
[EP] can lead to perverse behaviors, like not building inventory at the end of 2020, when we saw post-pandemic demand accelerating.
In its treatment of capital expenditures, traditional EP burdens results with both a capital charge and depreciation from the day an asset is acquired—after which the cost of owning the asset declines each year as it depreciates. This “double-charging” practice often causes EP to be negative for several years, even in the case of substantially positive NPV projects, which discourages investment and encourages the “sweating” of old assets well beyond their useful lives.
To address this potential underinvestment problem, at Fortuna Advisors we make two adjustments to conventional EP. First, we use undepreciated assets, and second, no depreciation is charged to earnings. The capital charge doesn’t decline over time, so the benefits of investing tend to show up sooner and without the illusion of value creation in later years as the asset depreciates away.
One executive pointed out how this single change to traditional EP helped transform their corporate culture by orienting the firm to a growth mindset:
Why implement EP? We see the industry changing before our eyes and need to grow more. … We designed our new [EP] metric to reward long-term performance during a period of transformation and change, and to focus on the company’s strategic initiatives to drive growth. … Transitioning to a growth mindset is also helping move us away from the silo behavior that resulted from our past focus on efficiency.
A second major barrier to long-term value creation is provided by GAAP’s insistence that corporate spending on intangible assets like R&D and brands be expensed immediately, thus penalizing these kinds of long-term investments. Taking R&D as an example, our approach adds back the expenses, while capitalizing them over an appropriate period.
Former Varian CFO Gary Bischoping described the effect of such an accounting adjustment as follows:
This removes any incentive to cut R&D to meet a short-term goal, so it promotes investing in innovation. At the same, since there is enduring accountability for delivering an adequate return on R&D investments for eight years, there is more incentive to reallocate R&D spending away from projects that are failing and toward those that project the most promising outcomes.[ix]
Yet another opportunity exists for improving typical EP implementations in companies where the main financial performance indicator is some form of profit measured against the annual business plan or budget. In this situation, there is insufficient resistance to continued spending on failing projects, since the waste is often already “baked” into the budget and won’t affect performance measurement. And any future payoffs from R&D won’t weigh much in the balance either, since by the time the payoffs materialize, they will also be included in that year’s budget, with little effect on recognition (or pay).
As this example suggests, it’s hard to overstate the importance of separating performance targets used in reviews and incentive rewards from plans and budgets. Combining them is an invitation to “sandbagging” or the near universal tendency of enlarging one’s own expected bonus by committing to substantially less than can be delivered. Substituting the prior year’s EP for budgeted targets removes the temptation and opportunity for gaming by objectively measuring changes in how current performance contributes to a company’s intrinsic value over the evaluation period.
With plans and budgets no longer used to set incentive targets, management teams are likely to avoid stressful, zero-sum negotiations that often limit instead of expanding the flow of information among business unit management, corporate leadership, and their boards. Using EP removes the temptation to sandbag budgets that understate potential and discourage experimenting on initiatives with uncertain payoffs. As one senior exec reported when sponsoring the implementation of an EP-based performance management system, the company’s new approach was designed to “reward people for their contributions to growth and shareholder value rather than how well they negotiate targets.”
Having divorced incentive payoffs from annual budgets, top management can then focus the planning and budgeting dialogue on setting aspirational goals and ensuring the best corporate strategies and tactics to meet them. To the extent investments succeed in producing EP, business unit and corporate management will both be rewarded—and if performance falls short, compensation should be reduced for all involved.
Under such a system, before proposing projects calling for capital investments, managers will be far more “vigilant,” as Adam Smith put it, when making decisions that call for spending investors’ capital. They are much more likely to act like owners in treating shareholder capital as if it were their own. Kimball Electronics’ Don Charon observed, “People need to trust their long-term business cases.” And as one CFO told us, the introduction of an EP system “flipped our investment review conversations away from financial targets toward strategic value and feasibility” and consequently, “we gained the commitment of our operators.”
Implementation Case Study: How CSX Adopted EP[x]
In its 2022 proxy statement the railroad company CSX described its transition to a form of EP called “CSX Cash Earnings” (CCE) to “measure whether returns on new investments exceed an expected rate of return and to encourage investments in growth projects” as well as “to reward long-term performance during a period of transformation and change.”
CFO Sean Pelkey led an interactive training session for his finance team intended to gain their buy-in for CCE and shift their thinking toward long-term value creation. They started by reviewing the three main paths to higher CCE:
- Improve cost efficiency and capital productivity, both of which have fueled the company’s substantial success in recent years.
- Eliminate unneeded assets to free up capital for more productive activities, which CSX has also pursued effectively.
- Make new investments whose projected returns exceed their capital costs—a key, and indeed perhaps the most important, aim of implementing CCE—without losing focus on cost efficiency and capital productivity.
Pelkey then asked his 30 teammates to individually list their three most important financial performance measures, so the group could consider how well each metric leads to good decision-making. Using the resulting composite list of 15 measures, they went one-by-one to discuss the merits and shortcomings of each.
FCF was the most cited, which was no surprise since CSX’s long-term incentive plan had used FCF to reinforce capital discipline in recent years. But, as Pelkey pointed out, although FCF is used to calculate net present value, it is not helpful as a single-period performance measure, particularly when the corporate goal is to increase profitable growth. In practice, focusing on FCF often proves to be an obstacle to growth since new investments reduce FCF unless return on investment exceeds 100% in the first year—a high bar.
Revenue growth came second. But however important growth is for many companies, growth for its own sake destroys value if returns on capital are below the cost of that capital. As in the case of FCF, the team considered the unintended consequences of an incomplete measure. The stock market is littered with companies—like General Motors before it went into Chapter 11— that went all-in on growth and lost control of costs. In the end, not only were GM’s shareholders wiped out, but roughly a third of the company’s workforce was let go. CSX was determined to achieve a very disciplined kind of growth—one which maintains both cost efficiency and capital productivity.
Next up were two more incomplete metrics, operating ratio and operating income. Operating ratio, which is calculated as COGS plus SG&A as a percentage of revenue, has been an important driver of success across the railroad industry over the past decade. But like almost all ratios, it ignores growth. In the words of Michael Jensen, “…if it is a ratio and if it is a performance measure it is wrong.”[xi] Operating income, by contrast, is a dollar measure rather than a percentage and does reflect growth. What it misses are the associated capital costs of the investment needed to produce that growth.
At the end of the session, the trainees could see how CCE helps clarify decisions by managing all the trade-offs required when using traditional, one-dimensional measures. And although it’s too early for the benefits of such change to have become clear, the use of a performance management system centered on CCE is expected to provide CSX managers and employees with a yardstick that strikes a smart balance between growth and efficiency, and thus greater clarity and conviction in corporate decision-making. The interests and actions of the many different parts of this large organization with more than 20,000 employees are being guided by a comprehensive measure that supports CSX’s efforts to encourage employees to act for the good of the company, thinking like owners or investors themselves.
Over the last three decades, we have seen company after company once devoted to efficiency and productivity try to incorporate a growth mindset, only to end up sacrificing discipline and earning inadequate returns on investment. The message of this article is that such transitions need not force a choice between efficiency and growth. By using a financial management system with EP as its core, companies can aim for the best of both.
The Art and Science of Implementing EP
Every management interview confirmed our experience that EP implementations yield much better results when executives think of EP as the agent of a “transformation” rather than a simple business-as-usual “installation.” Managers shouldn’t expect to educate employees on how the new metric is calculated, move on to their next task, and then reap the benefits. They need to consider how to adapt critical decision processes for EP and shape corporate culture in parallel. And such a transformation requires the visible commitment and support of senior leadership.
Successful EP implementers like Don Charron at Kimball Electronics acknowledge the importance of a rigorous and sustained change management effort:
Many people just dip their toes in and fail because they don’t go deep enough and stick with it. This has been a decades-long journey for us. I talk to many CEOs and am convinced that our approach is the best for decision-making, incentives, and for pulling together culture and strategic execution.
EP leaders also think long and hard about how best to communicate effectively across their organizations, making sure employees at all levels understand financial results and how individual efforts contribute. A high level of visibility also supports the shared view, and common language, of value creation we emphasized earlier. One CEO described how their culture is premised on, and reinforced by, a widespread sense of mutual accountability, “We purposefully shine the light on both good and poor results.”
Regular town halls are a popular forum for company-wide communications to facilitate practical learning about EP. An executive in the early stages of implementation counseled, “Start with core principles like ownership, growth investments, and the need for more innovation. These are basic concepts any business leader should get.”
As with any valuable change effort, regular training should be part of every EP implementation and tailored for each audience. The experience reported by Worthington Industries is likely to be helpful for others:
The tools and values need to be constantly reinforced, otherwise even finance people start to view EVA as a compliance metric. We strive to make it real and show people how to use it, and how to evaluate projects all the way to the shop floor.
As we have argued throughout these pages, for EP to influence decision-making and shape behaviors, it must be properly integrated with key processes, including the setting of long-range goals, capital budgeting, strategic planning, R&D portfolio evaluation, brand building, and corporate development. One best practice we frequently encountered was to “build EP into all templates for capital approval.” Caterpillar’s Andrew Bonfield goes so far as to make EP part of their rigorous post-mortems; in his words, “by taking a systematic and fact-based approach, we have been able to document and reduce over-optimism in our forecasting efforts.”
As we saw earlier, compensation committees make deliberate choices about whether to use EP in their annual incentives, long-term incentives, or both. One recent implementation by Elanco Animal Health is described in their April proxy statement as follows:
For 2022, the Compensation Committee has approved a new financial metric, “Elanco Cash Earnings,” [ECE] as the sole company performance measure under our annual cash incentive program. This measure will replace the 2021 metrics of revenue, adjusted EBITDA and innovation performance described above. The Compensation Committee selected this cash-based economic profit measure because it incentivizes both growth and return on capital invested in our business, and because it believes that [ECE] will positively correlate with total shareholder return.
…The Compensation Committee believes that this metric better aligns with our growth and value creation strategy, which is to drive innovation over relatively long product cycles through ongoing prudent investments in R&D.
During his second quarter investor call, Elanco’s CEO Jeff Simmons credited the company’s adoption of ECE with “driving a company-wide ownership mindset and intensifying our focus on delivering capital optimization. I believe this mindset and ownership culture will drive value for all stakeholders over the long term.”
Managerial Lessons: Time for Change
Our research makes a strong case for change and provides practical guidance for how to implement a successful EP-based value management system. Companies using economic profit outperform their peers on shareholder returns (TSR), build effective cultures based on ownership and accountability, and earn investors’ approval. Bringing an investor lens to bear on internal measurement and investment decisions becomes critical in a VUCA environment with elevated capital costs and more cautious banks, private lenders, and bondholders.
Most business leaders have a basic understanding of the central role resource allocation plays in creating value, and it’s rare to host a quarterly earnings call where sell-side analysts are not holding the CEO and CFO’s feet to the fire. Even more relevant is the buy-side investor view, summed up by Charles Kantor, managing director and senior portfolio manager at Neuberger Berman:
What we are really looking for is a demonstrated ability to produce cash flow rates of return on total invested capital that exceed the cost of capital. And what we tend to be impressed by are management teams that can talk in an impressive amount of detail when asked one particular question: How does your company allocate capital?[xii]
Beyond traditional institutional and retail investors, we expect more activist shareholder interventions as performance for many companies and business units falls short of expectations. So, it’s now imperative for senior executives to credibly articulate how they plan to achieve current results without sacrificing profitable future growth. As we’ve demonstrated, EP is the best single metric for enabling managers throughout the company to make the right investment decisions in real time as they confront volatility, uncertainty, complexity, and ambiguity in their markets.
JEFFREY GREENE is a senior advisor counseling companies and colleagues on how to achieve their full potential. He was the global vice chair of corporate finance at EY and is the editor and lead author of The Stress Test Every Business Needs: A Capital Agenda for confidently facing disruption, difficult investors, recessions and geopolitical threats.
GREG MILANO is founder and chief executive officer of Fortuna, with more than 30 years of experience in value‐based management. His research has been widely reported, including in Fortune, The Wall Street Journal, and Financial Times. He is the author of the book, Curing Corporate Short‐Termism: Future Growth vs. Current Earnings.
ALEX CURATOLO is a vice president who advises clients on economics and strategy. In a prior role she consulted on transfer pricing and other international tax issues.
MICHAEL CHEW is manager of thought leadership. He holds a master’s degree in finance from Simon Business School at the University of Rochester.
[i] See, for example: Mankins, Michael, and Mark Gottfredson, 2022. “Strategy-Making in Turbulent Times.” Harvard Business Review, September–October, 2022.
[ii] See: Hopson, Frank, and Jason Gould, 2022, “Be Less Equitable When Allocating Resources,” CFO.com, March, 2022; and Atsmon, Yuval. 2016. “How Nimble Resource Allocation Can Double Your Company’s Value.” McKinsey & Company, August 2016.
[iii] Median TSR of top and bottom quartile measured from January 1 to November 17 for each year.
[iv] While the availability of data varied for individual companies, we had a minimum of four years for each through December 31, 2021, making the TSR comparisons especially impressive. See the Methodology box for a complete discussion.
[v] For a full discussion, see Milano, Greg. 2019. “Beyond EVA.” Journal of Applied Corporate Finance 31(3).
[vi] Jenson, Michael, and William Meckling. 2009. “Specific Knowledge and Divisional Performance Measurement.” Journal of Applied Corporate Finance 21(2).
[vii] Bruff, J. Michael, and Marwaan Karame. 2020. “How One Company Drives Ownership Behavior to Innovate and Create Shareholder Value: The Case of Varian Medical Systems.” Journal of Applied Corporate Finance 32(2).
[viii] O’Byrne, Stephen F., and S. David Young. 2009. “Why Capital Efficiency Measures are Rarely Used in Incentive Plans, and How to Change That.” Journal of Applied Corporate Finance 21(2).
[ix] Milano, Greg. 2019. “Beyond EVA.” Journal of Applied Corporate Finance 31(3).
[x] This case study is adapted from: Milano, Greg. 2022. “Rethinking the Value of 3 Common Financial Metrics.” CFO.com, July, 2022.
[xi] Jensen, Michael. 2000. “The Role of Compensation in Internal Governance.” Evangelist,
Italy, 2000, Volume IV, Issue IV.
[xii] Greene, Jeffrey. (moderator). 2007. “Enterprise Valuation Roundtable Presented by Ernst & Young.” Journal of Applied Corporate Finance 19(2).
