
Modern corporate finance has revolutionized the business world. Compared to their counterparts of 50, 30, or even 20 years ago, today’s senior executives are better equipped to determine how business strategies, operating tactics, and periodic financial performance influence their companies’ share prices. Even most CEOs that lack formal financial training have a working understanding of valuation multiples, discounted cash flow, return on capital, and the cost of capital. This understanding of valuation has focused attention on and led to a notable improvement in corporate returns.
Our research shows that during the five years ending in 2009, 59% of the 1,000 largest non-financial U.S. companies (based on market capitalization) earned returns on capital above their cost of capital. Executives have learned that equity capital is a scarce and costly resource, and that delivering high rates of return is a key part of adding value.
Despite such advances, the increased attention to returns has come at a price. Many executives have become so preoccupied with maximizing rates of return that they turn down highly profitable growth opportunities, even those earning well above the cost of capital, if they fear the investment could dilute the overall returns of the company. In other words, the value-maximizing balance of growth and return appears to have been lost.
When I ask CFOs, as I often do, whether they would sacrifice 0.25% of their return on capital to invest in and get another percent of growth, most say they do not generally consider this tradeoff directly. But getting this balance right is one of the biggest challenges facing today’s corporate managers.
Just as investing too much leads to low returns and the destruction of value, investing too little and passing up on desirable investments limits potential value. In many industries, managing this tension between returns and growth will determine tomorrow’s winners and losers.
This is not a matter of theory, but of practical choices between returns and growth when making important strategic and tactical choices. Many companies are limited in how much value they can generate from existing assets. Raising prices can scare off customers, reducing volumes, and squeezing suppliers can drive them to competitors. And for those companies that achieve higher returns, competition often intensifies. As a result, to maximize value creation, the efficiencies reflected in higher returns must often be augmented with fresh investment, even if that means somewhat lower returns.
For example, while retailers should drive efficiencies so that each store generates maximal returns, they should also open as many stores as practical with acceptable incremental returns, possibly reducing the consolidated corporate return. Or, consider a company that expands the corporate sales department. Although this will add costs and may drive down returns at first, a successful expansion will increase sales and rates of return now or in the future. In some cases the returns never get back to where they started, but the right question to ask is: Does the increase in growth promise to increase value? That is, even if the investment causes returns to decline, is the longer-run return on the incremental capital high enough to exceed the investors’ required return? The proactive CEO is continually weighing such decisions.
To be sure, pursuing growth to the point of allowing the return on capital to decline in an environment where investors often insist on high returns takes courage and persistence. But what are investors really looking for? The anthropologist Margaret Mead once said, “What people say, what people do, and what they say they do are entirely different things.” It is better to go by what investors do than what they say.
And the market tells an interesting story on the question of growth versus returns. Our recent analysis of the 1000 largest non-financial companies that were public from 2000 through 2009 shows that only about 14% (or one in seven companies) had revenue growth that was higher and a return on capital that was lower in the second half than in the first half of the decade. But over half of these higher-growth lower-return companies generated total shareholder returns that were above the median returns for non-financial companies. Among them were well-known companies in a variety of industries, including Oracle, Tupperware, Pepsico, Hospira, CVS Caremark, Dick’s Sporting Goods, Procter & Gamble, Adobe Systems, and Automatic Data Processing. When value can be created with higher growth and lower returns, investors seem prepared to recognize it.
Oracle is a noteworthy example. During the first half of the decade, Oracle’s return on capital hovered between 33% and 36%, while its growth averaged only 3%. During this period, the company’s total shareholder return fell 8% shy of the return of the NASDAQ. During the second half of the decade, Oracle made substantial investments, including the acquisitions of Peoplesoft, BEA Systems, Seibel, and Hyperion, with the result that growth surged to 18% . Even though its return on capital fell to the range of 15-25% during this period, investors responded favorably to Oracle’s emphasis on growth, bidding up its share price to the point where its total shareholder return outpaced the NASDAQ by 73%.
The message to corporate executives is clear: Many of today’s companies earning high rates of return could likely increase their value over time by sacrificing some (though not too much) of those returns for higher growth. Greater emphasis on optimizing the growth versus return trade-off can help companies avoid what can become a value-reducing obsession with maximizing returns.
Proponents of modern corporate finance advocate the use of a long-term net present value (NPV) decision-making framework, which most companies include in at least some of their management processes. But for a variety of reasons, despite having sound analyses of long-term value implications available, many executives place too much emphasis on the near-term impact on returns and turn down promising growth investments. In the pages that follow, I describe the principles behind an approach to balancing growth and returns that has proven effective in strategic planning, budgeting, resource allocation, performance measurement, and incentive compensation. Though these principles should also apply in financial institutions, this framework has been designed and tested using non-financial companies.
Net Return Measures Stifle Growth
For decades, the use of rate of return and economic profit measures has increased, leading to improvements in asset efficiency. Between 1993 and 2005, the ratio of revenue to gross property, plant and equipment of current S&P 500 companies increased by over 20% (though this has pulled back recently). While this improvement partly reflects a macro shift toward less asset-intensive service businesses, many companies have tightened their capital expenditure discipline and boosted asset efficiency without changing their business mix.
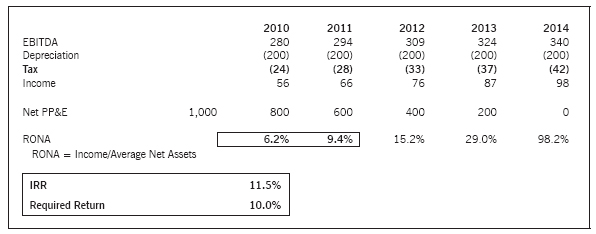
The vast majority of return measures, including ROE, ROA, RONA, ROIC and ROCE, are based on GAAP financial accounting, with depreciation treated as a period cost and returns measured against an asset base that is net of accumulated depreciation. Given the cash flow profile of a typical depreciating asset, the result, as shown in Exhibit 1, is a return measure that starts low and improves over the life of the asset as the denominator is depreciated away.
For the most recent year, among the 1000 largest non-financial companies, those with average asset ages under two years had an average return on capital that was 3.8% lower than companies with average asset ages of three to four years. These lower returns result from the front-loaded cost of new assets—an accounting distortion of economic reality that can discourage investment in new assets by companies that use accounting-based rate-of-return measures.
Although accounting statements are an important source of information used by investors to assess value, the connection between reported earnings and stock prices is far from straightforward. In principle, the market establishes an “expected” or required return, which is often assumed to be the weighted average cost of capital (WACC). When a company delivers sustainable returns that match the required return, the value of that company should be roughly equivalent to the amount of capital contributed by shareholders and lenders; in such cases, value is neither created nor destroyed.
For those companies that demonstrate the ability to achieve sustainable returns that are above the required return, the market value of the company ought to rise above the amount of investment, thereby creating value for shareholders. But for those companies that generate returns that are consistently below the required return, the value of the company is expected to drop below the amount of investment—in which case value is destroyed.
In practice, however, these relationships are not evident when using conventional rate-of-return measures. For nearly all companies, asset market values are significantly higher than depreciated book values, causing the overall level of corporate investment to be understated by accounting net book values. Contributing further to this understatement of cumulative investment is the GAAP rule that requires the expensing—as opposed to the capitalization and amortization— of long-term investments such as R&D, advertising, and employee training. The resulting conservative balance sheet, while perhaps helpful for creditors and rating agencies when estimating liquidation values, is generally not useful for shareholders when trying to assess the market values of companies as going concerns.
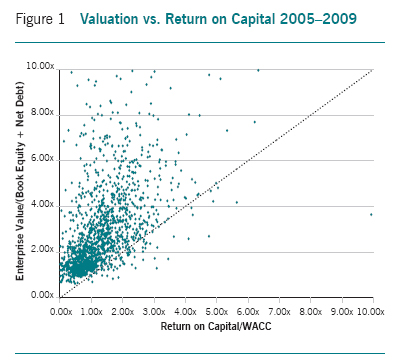
This point can be illustrated by examining the returns on capital of large non-financial companies in relation to their estimated WACCs for the last five years ending with 2009. For any given company, we define the “Performance Ratio” as the Return on Capital divided by WACC and the “Market Valuation Ratio” as the “enterprise value” (or the market value of its equity plus book value of debt) divided by its net book debt plus book equity. The expectation is that a company with a Performance Ratio greater than 1.0 has added value to its investors’ capital contributions (including accumulated retained earnings) and thus should have a Market Value Ratio above 1.0. Those companies with Performance Ratios below 1.0 are generally viewed as value destroyers, and their Market Valuation Ratios are expected to be below 1.0. In fact, barring a major expected shift in performance, the Performance Ratio is expected to be roughly equivalent to the Market Valuation Ratio.
What we find, though, as shown in Figure 1, is that over the five-year period of our analysis, almost 95% of companies had Market Valuation Ratios that were higher—and in many cases, significantly higher—than their Performance Ratios. One possible interpretation of this finding is that virtually all companies are expected to improve their performance in the future, regardless of their stage in the business cycle. But I will suggest three other, and to me much more plausible, possibilities:
1. Front-loaded depreciation charges cause reported corporate returns on capital to understate properly measured economic returns.
2. WACC overstates the required return demanded by investors in terms of current performance.
3. Valuation ratios are overstated by using understated asset bases.
Although each of these three possibilities likely plays a role in producing the imbalance shown in Figure 1, for each company some of these factors are more or less important, depending on the circumstances of the specific company.
A Better Measure of Return
The use of simple accounting-based return measures viewed in relation to WACC, although easy to understand and implement, is likely to discourage promising growth investments. On the other hand, complex models with numerous adjustments of GAAP accounting are difficult to implement, creating frustration for corporate executives, particularly those without formal training in finance. When faced with such complicated performance measures, many operating managers simply give up on financial analysis as “too theoretical.” Major growth investments are instead justified on “strategic” grounds while attempts at financial justification become “just going through the motions.”
So how can we design financial tools that are capable of showing the value of a sound corporate growth strategy while being simple enough to be used by corporate managers at all levels? In recent work, my colleagues and I have used well-established principles of modern corporate finance to take a fresh look at how the market values companies with the goal of designing a new and relatively simple measure of performance that better correlates with the corporate values observed in the market. We call our new measure “Gross Business Return.”
Starting with a simple measure of after-tax operating profit divided by net operating assets, we refined the definition of Gross Business Return based on rigorous market tests so that only those accounting adjustments that materially improved the correlation with market values across industries were included. There are three main adjustments to accounting: (1) the use of current dollar historical cost for fixed assets, which removes depreciation and accumulated depreciation; (2) the capitalization of R&D; and (3) the capitalization of operating leases. (See the Appendix for more details.)
The numerator is called Gross Cash Earnings, which is calculated simply as EBITDA before the cost of rent and R&D less the tax provision. The denominator is Gross Operating Assets, which is similar to net assets, but with the fixed assets stepped up to gross assets in current dollars, plus capitalized R&D and operating leases.
Gross Business Return is designed to maintain a close fit with the valuation of the 1,000 largest non-financial companies, while keeping the measure simple and intuitive. For some companies, economic returns cannot be evaluated without making additional adjustments to accounting. For example, GM cannot be evaluated without including their unfunded pension liabilities. But this is clearly an exception—one that is best treated on a case-by-case basis rather than complicating the measure for all companies and industries.
Some have expressed concern that using EBITDA as the starting point to calculate Gross Cash Earnings ignores the need for capital recovery through some form of a depreciation charge. This potential gap is mitigated by maintaining assets at the gross undepreciated level, adding cumulative inflation to the fixed assets and solving for the Required Return that captures not only the investors demand for a return on capital but also a return of capital, spread out over the life of the asset as discussed below. The same approach applies to the treatment of capitalized R&D.
This measure can be used either with or without goodwill, depending on the circumstances and purpose of the analysis. Gross Business Return excludes goodwill and is generally the best measure to use when evaluating operating performance or deciding whether to approve organic investments. But when assessing management’s effectiveness in employing all investor capital, the addition of goodwill to the asset base ensures that the full cost of acquisitive growth is considered. And when making acquisitions, goodwill must be included in the analysis as well. We call this measure “Gross Acquisition Business Return.”
Although new investments should always be evaluated on the expected incremental returns, many companies use current returns to guide investment strategy. This kind of analysis can help keep strategic decisions grounded in reality as long as executives keep in mind that past returns are no guarantee of future success. When companies are evaluating organic investments, the use of operating Gross Business Return without goodwill generally provides a better signal of the current business economics. This ensures that the goodwill paid when acquiring businesses in the past does not discourage executives from investing organically in businesses with desirable operating returns, regardless of what they paid to acquire the business.
A Fresh Look at the Required Return
The Required Return is the expected return needed to persuade investors to commit their capital. It is also the return that will cause investors to set the company’s value equal to the amount they have invested, no more and no less, so we call it a company’s “Zero NPV point.”
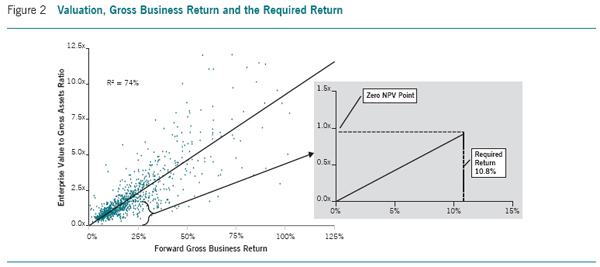
To determine the Zero NPV point, we start by defining the ratio of Enterprise Value to Gross Assets, which is a company’s enterprise value (market value of equity plus book value of debt and equivalents) divided by the same Gross Operating Assets used when calculating Gross Business Return. Our regression analysis, as illustrated in Figure 2, shows that the relationship between Gross Business Return and the Enterprise Value-to-Gross Assets ratio provides both a better statistical fit and a more balanced relationship between performance and valuation.
For the market as a whole, the Required Return is defined as the Gross Business Return that, on average, would cause the firm’s Enterprise Value to equal its Gross Assets, as shown in the right hand graph of Figure 2. In this framework, the Required Return replaces both depreciation and the cost of capital in the traditional analytics and captures the investors’ combined demand for return of capital and return on capital.
Investor sentiment cycles between bull and bear markets due to changes in the supply and demand of desirable investments, aggregate investor risk aversion, and other factors. Our approach identifies these shifts in investor sentiment by tracking the market derived Required Return over time. When market valuation is high relative to operating returns—as happened in 1999 as well as in 2007—the regression line in Figure 2 rotates upward and the Required Return declines. Investor optimism during such market peaks has the effect of reducing the return requirements to create value. The same works in reverse during deep market troughs, as in late 2001 and early 2009, when the regression line rotates down and the required return rises. Concerns about risk at the bottom of the valuation cycle lead investors to demand higher returns to compensate them for their perception of increased risk.
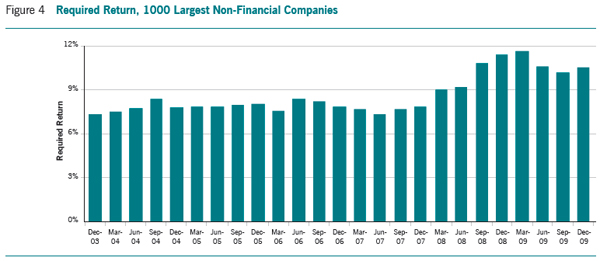
We analyzed the Required Return on this basis for the 1,000 largest non-financial companies at the end of each quarter going back to December 2003. During these 25 quarters, the median Required Return was 8.0%, which suggests that the threshold to create value in the eyes of investors is considerably lower than covering accounting depreciation and earning a weighted average cost of capital in the traditional model, especially for assets in the first half of their life. But why is the market satisfied by such low returns?
The Value of Growth and Growth Options
How do we reconcile this seemingly low Required Return with the modern corporate finance principle that value is created when the cash flow generated by an investment discounted at the weighted average cost of capital (WACC) exceeds the amount of investment? Are Discounted Cash Flow (DCF) or WACC flawed? I argue that DCF continues to be the right way to value investments and WACC is conceptually correct as well, but in practice it is easy to leave out important aspects of how investors value growth.
Although Gross Business Return shows a stronger correlation with corporate value than conventional return on capital, many companies are valued somewhat higher or lower than returns alone would suggest. By separating these companies into quartiles based on the degree of perceived over- or undervaluation (relative to returns), we gain insights into other important drivers of valuation.
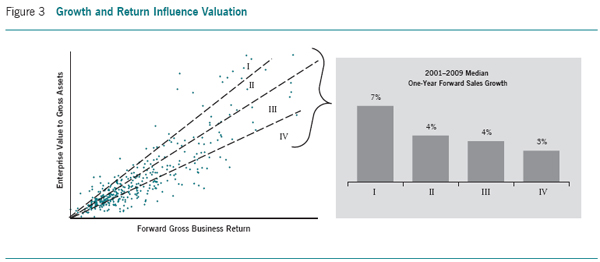
One of the most important drivers of a premium or discount valuation relative to returns is consensus expectations about sales growth. Companies that are valued more highly than others with the same level of return tend to have higher top-line growth. In fact, our research suggests that many high-return companies might achieve higher valuations if they increased top-line growth even while allowing some decline in their average return. The possibility of trading off return for higher growth is suggested by Figure 3, which shows that companies in the highest quartile (I) of valuation relative to return have markedly higher top line growth, while firms in quartiles II, III and IV have declining growth expectations.
When considering new investments, executives often emphasize returns more than the impact on top-line growth. Although maintaining high returns can be very desirable, Figure 3 suggests that some companies may be able to add value by achieving a different balance between return and growth—that is, by forgoing at least part of their high returns for more top-line growth.
Furthermore, under certain conditions companies can add value even when making investments that may be modestly negative on a traditional DCF basis. As has long been recognized in the “real options” literature originating with Stewart Myers, many corporate capital investments have the effect of creating strategic option values by giving companies the right, but not the obligation, to either expand promising investments or cut back or end investments whose benefits fail to materialize. The value of these future options, if recognized by investors, would serve to reduce their need for current returns and may explain why the market is satisfied by the low Required Returns we measured in our research.
Some investors and executives, possibly based on some version of the theory of “zero profits” in competitive markets, believe that, on average, corporate investments are zero-NPV projects and hence “don’t create value.” And many believe the companies that earn superior returns tend to be offset by the low returns delivered by the rest, resulting in average returns that just meet the Required Return. But when we looked at what actually happens, we found that the largest 1,000 U.S. non-financial companies generated an aggregate 2009 Gross Business Return that was 1.5 times our estimate of the Required Return during this period.
Another way of interpreting this finding is that the market’s required return has averaged about two thirds of the actual corporate return during this period. In this sense, two thirds of the value of the incremental corporate earnings produced by new corporate investment can be seen as satisfying investors’ minimum return requirements, while the remaining one third are “value creating.”
This interpretation is remarkably consistent with the findings of a recent study by Trevor Harris and Doron Nissim that attempts to show how the market responds to two different sources of increased corporate profits: (1) increases in earnings attributable to new corporate investment and (2) increases in earnings that require no new corporate investment. Focusing on U.S. non-financial companies during the period 1978 through 2002, Harris and Nissim found that increases in corporate operating earnings that were achieved without increases in capital investment were associated with increases in value that were roughly three times the value increases associated with the earnings improvements produced by new capital investment.1
What does this tell us? There are really two distinct messages. The first, and most obvious, is that equity capital is quite costly and that investors accordingly place a significant premium on earnings increases achieved without the use of more capital (this is likely one of the keys to the success of capital-shrinking transactions like LBOs over the years). The second and more relevant message for our work is that new corporate investment also adds value, on average, even in cases where the returns take time to materialize—and this finding holds up over the 25-year period studied by Harris and Nissim. Moreover, their finding that earnings from efficiencies generate three times the value of earnings associated with investment is consistent with our finding that two thirds of the value of cash flow is consumed by the required return and one third is value creating.
In addition, Harris and Nissim’s general finding about the profitability of corporate investment is supported by our observation that the Enterprise Value-to-Gross Asset ratio was nearly 1.40 at the end of 2009. What this ratio suggests is that, for every dollar of investor capital that corporate managements received or retained and invested in the business, the market at the end of 2009 was expecting management to add a net present value of about 40 cents. This is evidence that investors expect and are willing to invest at stock prices that reflect substantial expected value creation, particularly when we consider that this valuation premium is on top of an asset base that includes current dollar historical cost for fixed assets (including accumulated depreciation and cumulative inflation), capitalized R&D, and capitalized leases.
The clear message derived from these market tests, then, is that competition in the U.S. corporate sector does not produce a zero-sum game; companies really do create value for investors—significantly more than they destroy. This suggests that we should expect upside, on average, as companies redeploy their future cash flow into new and promising growth opportunities—future opportunities that are made possible mainly by their current investments. As I suggested earlier, the option value created by having the right, but not the obligation, to redeploy future cash flows at returns above the required return has the effect of driving down the near-term required return.
While valuing such strategic options is by no means straightforward, the field of real options has provided ever more useful tools for this application. For our purpose, it is enough to recognize that the creation of strategic option value augments current performance in delivering overall returns to investors, and this is an important explanation for why investors accept the lower Required Returns discussed above.
The Timing of Growth Investments
During the 25 quarters that we tested, the Required Return hit a low of 7.3% in June 2007 and a high of 11.7% at the end of March 2009. This wide range, as illustrated in Figure 4, appears to indicate periods of market overreaction on both the up and down sides.
History and considerable research suggests that required returns are mean-reverting. So for investors and companies alike, investments made when the market required return is below the long-run average are likely to earn lower rates of return, while investments made when required returns are above average are likely to produce higher returns. This amounts to buying stocks after selling has driven down the prices—and selling when the market is high.
The problem, however, is that most companies don’t follow this investment strategy. Instead they tend to invest heavily in acquisitions, organic growth, R&D, marketing and advertising when the economy—and their own operating cash flow—is strongest, which is a prescription for overpayment and value-destroying investment. Conversely, when the economy is depressed and assets are cheap, most companies allow their reduced earnings, depletion of cash resources, and risk aversion to limit their own investment, precisely when the expected payoffs are greatest.
To encourage “Buy Low and Sell High” behavior, companies ought to consider the use of a smoothing mechanism to establish a long-run average Required Return for corporate strategy decisions. If properly integrated into the financial management processes of the company, this could encourage more investment at the bottom of the business cycle and less at the top, thereby reducing the cost of investment over time, delivering higher Gross Business Returns and creating more value.
How the Required Return Varies by Industry
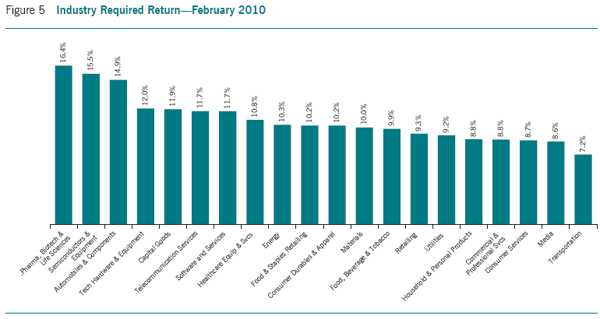
Although every company is different, there are characteristics that are shared to varying degrees by companies in each industry such as demand, growth, sustainability, operating risk, technology risk and financial leverage. These factors affect how investors value an industry relative to returns. A Required Return for each industry can be evaluated in a similar manner to the analysis presented for the overall market above. If an industry tends to trade at a discount in terms of value versus return, that translates into a higher required return.
The Industry Required Returns shown in Figure 5 reflect differences among industries in the relationship between valuation and return. Under normal market conditions, industries with lower Required Returns are those where investors tend to be satisfied with lower current returns because of the expectation of some combination of higher growth, greater consistency of returns, or lower fixed costs. Asset intensity and asset life affect the “return of capital” portion of the Required Return, and since these factors are vastly different by industry, they influence the Industry Required Return as well.
But, of course, markets aren’t always “normal,” and overreactions can clearly be seen at the industry level as well as in the broad market. By following the Pharmaceutical, Biotechnology, and Life Sciences industry over time, we see how the Required Return can vary based on many factors. From late 2003 until late 2008, the Industry Required Return tracked the overall Required Return for all large non-financials. But since the end of 2008, as shown in Figure 6, the Industry Required Return has increased dramatically and become more volatile as a number of government healthcare reform proposals with different industry implications have varied in likelihood of success. The uncertainty and potential for future erosion in returns has led investors to demand higher returns and, in the absence of any dramatic increase in returns, the valuations in the industry declined.
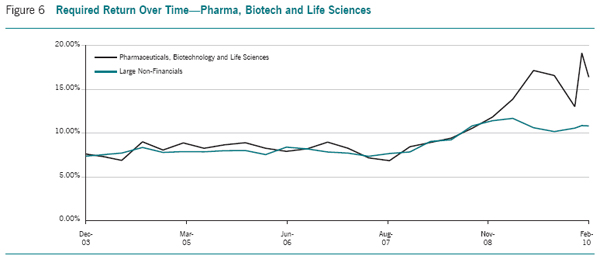
Are there more desirable opportunities for investment in this industry now because of such a high Required Return? That depends on the eventual impact of healthcare reform, but some very visible investors, including Carl Icahn, are now making big bets here.
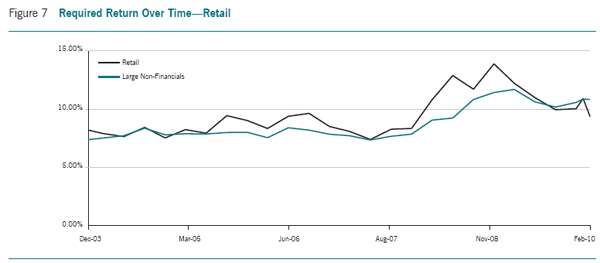
Another example is Retail. From 2003 through 2005, the Required Return was in line with the broad market. Then through early 2007, as can be seen in Figure 7, the Required Return increased when valuations trailed behind the increasing sector performance and investors seemed to question the sustainability of returns. In mid 2007, these concerns subsided briefly before the Required Return increased significantly ahead of the market. Recently, as signs of recovery have surfaced, the Retail Required Return has declined to the lowest level relative to the market over the period. Does this mean that Retail valuations are too rich relative to the market now?
In sum, there are many factors that affect valuation for a specific company, including growth, leverage, and volatility as well as industry. My colleagues and I are now conducting research to quantify the effects of such factors on a period-by-period basis to improve our understanding of how investors trade off these very important valuation drivers.
Applying the Right Tools to Balance Return and Growth
It is not enough to know how traditional measures of return are biased against growth and then simply introduce a new better return measure. To apply this framework in corporate settings requires user-friendly tools that can be incorporated into the strategic planning and decision-making process. The following introduces tools that executives should consider using as they pursue strategies that affect the company’s growth and returns.
Various measures of “economic profit,” including residual income and economic value added (or EVA), have become very popular in the last two decades. In principle, these measures have many desirable attributes that make them more reliable indicators of value creation than GAAP earnings. But as currently practiced, most measures of economic profit suffer from the same front-loaded costs that we discussed earlier. When using existing measures of economic profit, the total cost of ownership for an asset in terms of depreciation plus the cost of capital is the highest the day it is purchased, and declines every day thereafter until it is fully depreciated. Then it becomes free. Like accounting-based measures of return, economic profit measures create a disincentive to invest in new assets and a resistance to upgrading old assets that are fully depreciated.
A new version of economic profit that we call Residual Cash Earnings is based on the same principles as Gross Business Return. Residual Cash Earnings is calculated by starting with Gross Cash Earnings and subtracting the Required Return times the Gross Operating Assets:
RCE = GCE – [RR x Operating Assets]
The Required Return reflects the market’s demand for a return of capital and a return on capital. But in the first half of the life of an asset, the total cost of ownership is much lower than that faced by new assets measured using typical economic profit measures, thus creating fewer disincentives to invest and grow the business. As assets age, Residual Cash Earnings maintains a relatively stable (as opposed to sharply declining) cost of ownership as shown in the right graph in Figure 8, thereby eliminating the disincentive to replace and upgrade depreciated assets.
The valuation model discussed below is driven by both current and expected future Residual Cash Earnings—the internal measure executives must aim to maximize in order to create value and see their share prices rise. Though the concept of Residual Cash Earnings is not much different from economic profit, the signals it provides executives in practice are more growth oriented and better aligned with how companies are actually valued in the market. For much the same reason that EBITDA often provides better signals to managers than GAAP net income, Residual Cash Earnings improves upon existing measures of economic profit.
As we saw earlier, one of the major challenges facing today’s top executives is to achieve the value-maximizing balance between growth and return. When should we sacrifice return for growth and vice versa?
The measure of efficiency that makes this tradeoff as straightforward as possible is Residual Cash Margin (RCM), or Residual Cash Earnings divided by revenue. RCM measures the degree to which cash flows are adequate to exceed the Required Return, per dollar of revenue, so it can be directly compared to revenue. Constructed in this manner as a margin on revenue, it is conceptually similar to the Economic Margin framework employed by the Applied Finance Group and EVA Momentum introduced recently by Bennett Stewart.
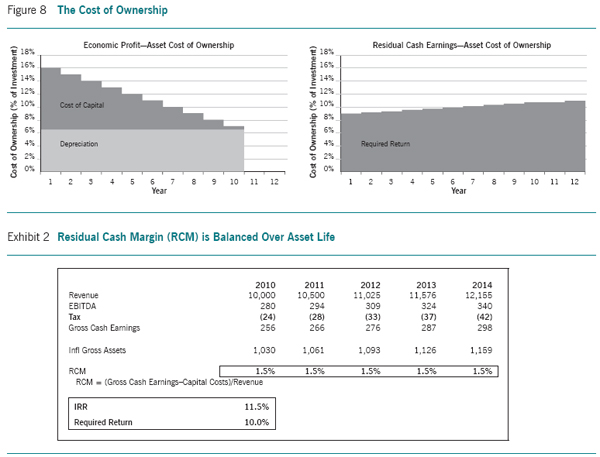
RCM is a measure of pricing, cost efficiency, and capital productivity that, as shown in Exhibit 2, recognizes efficiency in a more balanced manner over the life of an asset. The total cost of asset ownership, in terms of a return of capital and a return on capital, is smooth rather than front loaded, as shown in Figure 8. RCM is an efficiency measure that enables managers to see the possible effects of growth on value, and to balance growth against return. And since RCM is portrayed as a percentage of revenue rather than assets, it is likely to be more “intuitive” to managers accustomed to thinking in terms of profit margins rather than asset returns.
A New Twist on Valuation
Conceptually, DCF is the ideal valuation model since the cash flows expected from an investment or business are discounted using a rate that reflects the time value of money and the level of risk attributed to the cash flows. In the case of new investments, if the discounted cash flow value exceeds the amount of investment, the investment is said to have a positive NPV and should be pursued. For businesses, if the discounted cash flow value exceeds the amount that has been cumulatively invested in the business, management is said to have added value to the investment.
Although this is an ideal valuation framework in principle, in practice there are difficulties. Which cash-flow forecasting process should be used to avoid an analysis that is too optimistic or pessimistic? Companies should stay away from overly optimistic “hockey stick” forecasts, but they should also avoid being so conservative they become unwilling to commit to any but the safest and most predictable investments.
Which discount rate reflects risk properly? How far out should a company forecast? How should companies determine the terminal value at the end of the forecast? This last question is especially important, since the terminal value often ends up contributing most of the value.
These problems cannot be eliminated, but they can be managed and limited using a better framework. As it turns out, the discounted cash flow model can be emulated using Residual Cash Earnings. The Residual Cash Earnings valuation model computes the value of a business by starting with the Gross Operating Assets at the outset and adding the net present value of the future Residual Cash Earnings, including an objective market based terminal value as discussed below. Many question this technique since Residual Cash Earnings is not exactly timed with cash flows. But for every year that a cash flow item is on the balance sheet and not expensed against profit, there is a charge for the Required Return that compensates for the time value.
If this provides a similar answer, how is it better? The benefit is the quality of information available to the executive evaluating the output of the valuation model. The pattern of free cash flow over a forecast doesn’t tell us much. Should it be going up or down? By mixing cash generated with cash invested, executives lose the ability to judge the realism of what’s really happening to economic profits and returns. For example, over the last five years, quite a few companies, including Southwestern Energy and the FPL Group, had negative free cash flow every year while producing total shareholder returns well in excess of the S&P 500. By looking at the pattern of Residual Cash Earnings, executives can see if the trends are consistent with their understanding of the business. For example, if a business has very strong brands with solid loyalty, top management should not be surprised to see projections that show Residual Cash Earnings growing over a reasonable forward time period. At the same time, forecasts for less differentiated businesses might be expected to show Residual Cash Earnings that decline after reaching cyclical peaks and vice versa.
The terminal value in this valuation model applies the regression relationship between Enterprise Value to Gross Assets and Gross Business Returns to the return at the end of the forecast. Both the Required Return and terminal value can be based on the value-versus-return relationship at the time of valuation, or using the median relationships over some historical period. Although the former approach is more in tune with the current market, the latter approach is likely to be more useful in finding opportunities that might be expensive or cheap relative to where the market typically is over time. This latter approach may help instill a buy-low, sell-high mindset in the decision process.
Conclusion
Postmodern Corporate Finance builds on the principles of Modern Corporate Finance while adjusting for practical application problems experienced in corporations. The result is a greater emphasis on top-line growth such as existed before the intense emphasis on returns brought on by the ongoing shareholder value movement. It is no longer a matter of insisting on returns at the possible expense of profitable growth, but seeking a value-maximizing balance of returns and growth.
These new measures and analytical tools are suitable for strategic planning, budgeting, resource allocation, performance measurement, and rewards. Consistent application of these principles across these management processes provides a framework for constantly rebalancing the emphasis on growth and return to adapt to changes in the economy, industry, and competitive landscape. With Residual Cash Earnings as the ultimate period performance measure of value along with the two key drivers of revenue growth and Residual Cash Margin, executives are more likely to see value-adding growth investments in a positive light without needing to overcome the negative bias from traditional rates of return.
Appendix
The following provides additional detail on the adjustments to accounting used to calculate Gross Business Return:
1. Current Dollar Historical Cost: The single most significant adjustment we make to GAAP accounting data is to add back depreciation to income, which converts it to be closer to cash flow, and to add back the accumulated depreciation to arrive at the historic cost for depreciating assets, specifically
PP&E. This adjustment reverses the front-loaded cost problem and has the most material impact on the correlation with market value. It also improves the ability to compare the performance of new and old assets. Additionally, we adjust for an estimate of cumulative inflation using a GDP Deflator over the average age of the assets. This inflation adjustment improves the comparison of performance over time and across different geographies and currencies.
2. Capitalized R&D: GAAP accounting requires that R&D be expensed in the period it is spent because the benefits of the spending are largely unknown and difficult to measure. But this is not the way most companies or the stock market view R&D. Executives and investors understand that R&D is an investment that is expected to create future value for the firm. We add back R&D to the numerator and accumulate it in the denominator to treat R&D as an investment. Capitalizing the last five years of R&D with no amortization provides the best fit with valuation in the context of this analytical framework. It would be desirable to capitalize other expenses that have long-term benefits such as advertising and employee training, but these data are not disclosed consistently enough for rigorous testing.
3. Capitalized Operating Leases: Standard GAAP accounting charges rents against earnings while operating lease commitments are recorded in the financial statement notes. When calculating Gross Business Return, it is critical to remove the rent expense from the numerator and capitalize leases in the denominator to understand value, especially in the retail and airline industries where this is more material. Capitalizing rent improves the tracking of valuation, neutralizes most lease/buy decisions, and facilitates better benchmarking. There are many approaches to capitalizing operating leases, but a simple 8 times rent assumption holds up well in our tests.
1. T. Harris and Nissim, D, 2004, “The Differential Value Implications of the Profitability and Investment Components of Earnings,” Columbia University working paper.
2. Some take comfort when using a low discount rate in calculating discounted cash flow in the public disclosure that Warren Buffett uses a discount rate well below a traditional cost of capital as well. In The Warren Buffett Way, Robert G. Hagstrom, Jr. notes that the “discount rate that Buffett uses is simply the rate of the long-term U.S. government bond, nothing else.” He goes on though to say that “Buffett does admit that as interest rates decline he is apt to be more cautious in applying the long-term rate”. He apparently puts a floor on his discount rate to make sure he doesn’t succumb to “buying high” when the market is exuberant. Warren Buffett has made many good investments that those using higher discount rates would have avoided and it seems to have worked out well for him. But it is clear that using an “average discount” throughout the cycle helps encourage a “Buy Low, Sell High” state of mind.
