
At the highest level, management teams and boards need to decide between various capital deployment alternatives: debt repayment, cash accumulation, organic reinvestment in the business, acquisitions, dividends and share repurchases, to name a few.
To be successful, more capital should be allocated to business activities where high returns on the incremental investment are expected, and less where it is unlikely to be as lucrative – a process my colleagues and I call Strategic Resource Allocation (SRA).
Many companies underperform due to suboptimal SRA, which often results from too many different, and sometimes conflicting, goals. And few companies have a clear line of sight of where and why long-term value is created and destroyed, which requires the right metrics to clarify market desirability and strategic position.
Markets are desirable when they are growing and participants have an opportunity to differentiate their offering to command attractive levels of growth and rates of return. A company has a strong strategic position when they rank high relative to market competitors on differentiation, which allows them to either command premium pricing or gain market share, or a combination of the two.
Along with this lack of clarity, management decision-making often suffers from an absence of strategic commitment and accountability, and resources end up being “peanut-butter spread” evenly distributed across the organization to play it safe. And since many companies lack confidence in their resource allocation, they avoid delving into too much detail with investors. On top of everything else, they fear being too open, which can tip off competitors about their plans.
But investors understand the importance of this process, and where and how a management team allocates their capital, R&D, and marketing resources informs investors about its priorities. Investors and analysts ask questions at investor presentations and on earnings calls. Even though details may not be published, answers to these questions paint a picture of how well their resource allocation is aligned with the parts of the business where they have the best prospects for earning decent returns.
Many executives consider capital allocation to be an internal matter. But for companies that report segment information, investors can patch together a sense of how well management invests its resources.
Although disclosures vary, it is common to report revenue, operating profit, assets, depreciation and amortization, and capital expenditures. There is rarely much detail on what is included in each amount, so investors are left to make assumptions based on their own understanding of the business, which can sometimes be supplemented by sporadic information acquired through detailed analysis or discussions with management.
For example, say, in the second quarter of 2018, a company acquired a publicly owned company that now resides in one of the segments. If the investor knew the composition of the acquired company’s balance sheet at the time of the acquisition, and could also calculate the incremental goodwill and intangibles, they could make estimates of the composition of assets.
This can be supplemented with quantitative and qualitative information acquired during Q&A with management on earnings calls, at brokerage conferences, and during investor-day presentations. Indeed, many investor relations professionals view part of their role as ensuring analysts and investors get the information they need to build their forecast models of the company.
A Hypothetical Case Study
Consider a company with two operating segments, which we will refer to as Segment A and Segment B. It is fairly straightforward for investors to estimate the rates of return being earned and the reinvestment rates, and they can examine the relationship of these two factors to determine whether management seems to be making the right allocation decisions.
The company reports segment revenue, operating profit, and depreciation and amortization. By adding the depreciation to operating profit, investors can readily calculate an estimated EBITDA and EBITDA margin.
Management generally does not provide tax information, so investors can perform their segment analysis on a pretax basis or estimate taxes to get a general idea of where they earn better after-tax returns. And if there is an “unallocated” line in the segment analysis, investors can choose whether to allocate this somehow to the operating segments – some investors do so, while others may not.
To provide some background on our example, Segment A of our hypothetical company is the original business, and Segment B was acquired about five years ago. Segment A is more mature than its counterpart, and manufactures, sells, and services equipment and systems used by specialized manufacturing customers. They are the largest player in their market, though they have been losing share in recent years.
Segment B builds and sells equipment, and also rents equipment to customers on an ongoing basis, in a way that is similar to a SaaS business model (in that it involves recurring payments from customers). Management knows the margins of Segment B are lower, partially because of higher R&D and marketing expenses, but they avoid disclosing this for competitive reasons.
An investor can readily parse the data for the last few years to produce the analysis shown in Figure 1—where we see that Segment A is larger and shows higher estimated EBITDA margins than Segment B, though its revenue growth is meaningfully lower.
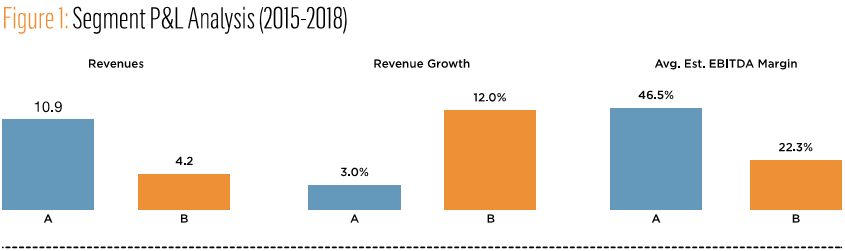
On quarterly earnings calls, the CEO and CFO often emphasize the high margins in Segment A, and wax on about cost discipline and lean principles. They avoid questions about how much R&D is allocated to each segment, but it is quite possible that the company’s performance and earnings power would be more accurately reflected if its high levels of R&D were treated as an investment (instead of an expense).
In our research at Fortuna Advisors, we found that performance measures tend to explain value better when R&D is capitalized, and this also takes the pressure off short-term earnings and holds management more accountable for earning a return on these investments over time.
But since R&D is not disclosed in the segment data, many investors tend to ignore it. To be fair, some pose questions during earnings calls and conference presentations to get a sense of such things, and a review of investor communication transcripts can hint at this information as well.
The stock market has not been kind to the company over the period, and management is somewhat puzzled since they have two healthy businesses and the consolidated company is growing with decent profit margins. What they may not realize is that investors may be digging deeper and finding out that, although the company is performing well now, management may not be investing in the right areas. To arrive at this conclusion, however, requires the investor to do more homework.
To take the analysis further, an investor can turn to the assets, but information on this subject tends to be limited. Most companies provide one total figure for assets, without any clarity on what is working capital versus fixed assets, and what intangibles might be included.
Often the best solution is for investors and analysts who follow a company to dig into other published information and, again, ask questions to get the non-public information needed to build out a more detailed model of business segments.
Although management teams often spend less time discussing rates of return than they should, most investors care deeply about the rate of return the company earns on its investments. They want to invest in companies with management teams that consider such returns when allocating capital.
Management must recognize that in order to achieve the same return on assets, a business with half the profit margin would need to have half the asset intensity (which we define as assets divided by revenue). In a sense, asset intensity tells us the “required margin.”
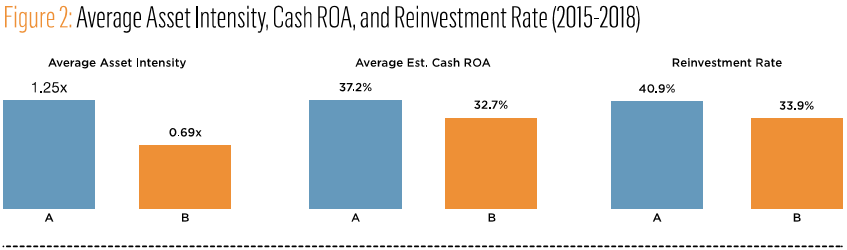
With the segment assets given, investors can calculate asset intensity, as shown in Figure 2, where we see that average asset intensity in recent years has been almost twice as high for Segment A than for Segment B. This, in combination with the estimated EBITDA information, allows investors to estimate an average estimated (pretax) cash return on assets (Cash ROA), which turns out to be slightly higher for Segment A.
Of course, investors can also derive a more traditional rate of return by dividing operating profit by assets. But our research shows cash-return measures better relate to valuation, although ideally we would prefer, for consistency, that the denominator be gross assets, rather than net of accumulated depreciation, but this information is rarely available.
The final graph in Figure 2 shows the “reinvestment rate,” which in this example indicates the estimated amount of capital expenditures and increased working capital, as a percentage of EBITDA. Note that Segment A has generated higher average returns, and management has invested in the segment at a higher reinvestment rate, so on the surface the results may seem acceptable. (Phew!) This may lead management to perceive its sluggish share price as even more of an enigma.
Before going any further, some readers may wonder where in the world investors get data on segment working capital. Such information can be deduced, at least approximately, from the change in assets, capital expenditures, and depreciation. There may be asset retirements, changes in intangibles, or other such items that obscure this analysis, but investors can use their judgment to refine their figures as needed. And if a company doesn’t disclose this information, many investors will simply endeavor to estimate it.
Interestingly, investors can consider how the findings of this analysis relate to the company’s business model. Specifically, in the case of Segment B, investors can tell that a large portion of the investment is directed at increasing working capital, as more and more equipment is held for rental over time rather than being sold at a point in time.
Management of companies that have historically sold equipment are sometimes concerned about switching to a rental model – especially since the immediate impact on revenue and profit is a decline due to the rent payment being significantly less than the sale price that would have been reported in the same period.
But in the rental case, there will be revenues for multiple periods, perhaps as long as five or more years. So the net present value derived from each piece of equipment can be higher than making a one-time sale, although this analysis needs to be conducted on a case-by-case basis.
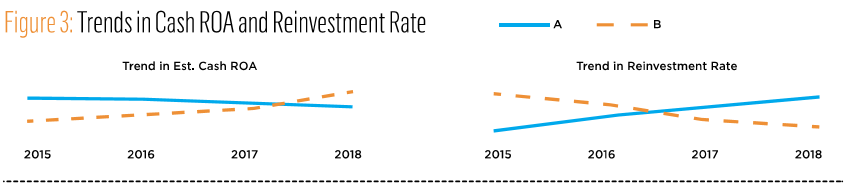
Again, on the surface it appears management is investing more where the returns have been higher. But when investors examine the trends in these variables, the findings can raise concerns. As can be seen in Figure 3, Segment A has high, but fading, Cash ROA, and the reinvestment rate is rising. In contrast, Segment B’s Cash ROA is on the rise, and was higher than that of Segment A in 2018; but the reinvestment rate has been reduced, and in the last year was substantially lower than that of Segment A.
An incremental Cash ROA can be calculated based on the incremental estimated EBITDA divided by the cumulative investment in capital expenditures and working capital over the period; and this shows a different story compared to the averages presented in Figure 2. Segment A was barely able to improve estimated EBITDA and earned less than a 1 percent incremental Cash ROA on about $6 billion in total investment over the period. Over the same period, Segment B delivered about a 70 percent incremental return on less than $1 billion of investment.
Investors may wonder how much better the results of the consolidated company would be had management increased reinvestment in segment B as its EBITDA skyrocketed, effectively sustaining the reinvestment rate of the segment. Of course, the company could have funded this by investing less, by an equal amount, in segment A, where incremental returns were negligible. They can run “what-if” analyses to simulate such a scenario and can use the results to rally other investors around the idea that management is allocating capital poorly, to the detriment of shareholder value.
What’s more, if they extrapolate this looking forward, they may forecast a meaningful drop in the overall corporate rates of return on capital, as more and more capital is poured into a struggling business, Segment A, rather than into an up-and-coming, and clearly more differentiated, business, Segment B.
This expectation of future bad investments would be the most likely reason for the company’s faltering share price, and it’s quite possible that the company’s management doesn’t even know that investors are performing this type of analysis to come to such conclusions.
Investors will also wonder which segment-related factors led to such results. Perhaps Segment A has been dominant in its product markets, and it is benefitting from inertia – that is, many of its historic customers may remain, but each year a handful walk away, and this is why it is losing market share. To combat this, perhaps the segment’s management has been cutting prices and thus the business is suffering from a decline in margin.
Or perhaps its aging facilities have required above-average capital expenditures to replace and upgrade equipment. In any case, this “story behind the numbers” will drive the questions investors ask when they meet and communicate with a company’s management.
Companies should do this analysis on their own segments and make sure the signals investors receive are accurate and perceived as intended.
There are, of course, limitations to this type of analysis. Since good and bad businesses can be mixed in the same segments, the business performance details may be quite different from our quick estimates based on segment reporting, and the numbers can become clouded when managements try to influence their interpretation.
For example, in some cases management may be trying to make some segments look better through allocations and transfer pricing – of course within the constraints of accounting rules (for the most part). Perhaps a manager would like a segment that normally attracts a higher multiple to show a bit more profit. This, of course, is spin, and investors are on the lookout for such deceptive tactics and won’t hesitate to downgrade their outlook of a company if they suspect such unscrupulous methods.
But despite the possibility of managerial distortions and the limitations of accounting disclosures, investors do care, and inform themselves, about capital allocation. And investor relations professionals should be aware that investors can do this type of segment analysis and will form judgments on whether they believe management understands and embraces the value of investing more where returns are higher.
Greg Milano is the co-founder and chief executive officer of Fortuna Advisors LLC, a value-based strategic advisory firm. This article is adapted from his book, “Curing Corporate Short-Termism.”
