Shrewd investors commit funds to companies they expect to rise in value, while reducing their exposure to those they expect to be relatively flat or down. The same principles ought to be applied inside companies, where management teams should ‘disproportionately’ allocate capital, innovation, and marketing resources to the products, services, brands, regions, and businesses they expect will create the greatest value and draw resources away from business areas where they expect performance to be flat or down. We call this process strategic resource allocation, or SRA.
Seems simple, right? Nearly every executive we meet acts as if these statements are intuitively true. Yet, a careful analysis of allocation decisions inside company after company shows that many often smear resources uniformly across business lines without enough recognition of where the best opportunities lie. Sometimes it results from managers’ misguided desire to be equitable to business lines, or due to the internal political hierarchy. But, most often, the culprit behind such suboptimal decision-making is a lack of insight into a company’s various value-creation prospects.
Identifying and Investing in Winners
The starting point for an effective SRA process should be to chart an ‘economic map’ of the various products, services, brands, regions, or businesses that represent ‘value centres’ for the company. To do so, companies must consider tradeoffs between various capital deployment alternatives, which requires a comprehensive measure that is consistently correlated with value creation. Unfortunately, most companies use traditional performance measures which, despite their popularity, fail to ‘reliably’ indicate value creation.
Pure income statement measures like revenue growth, profit margins, EBITDA, and EPS all suffer from inadequate recognition of the amount of investment required to deliver the growth or profits. This was supposedly remedied by return measures such as return on invested capital (ROIC) and return on equity (ROE), but these indicate quality only as percentage rates of return and not the overall quantity of growth. In the 1990s, economic value added (EVA) came into favour due to its professed ability to balance both performance dimensions, quantity and quality, into a single metric. To explain it simply, EVA is a variation of economic profit that is calculated as net operating profit after taxes less a capital charge based on the amount of capital multiplied by the weighted average cost of capital.
But, alas, EVA proved to be prohibitively complicated for many companies that adopted it. This was because it requires a wide range of accounting adjustments, which makes it hard for managers to see how it relates to their plans and decisions. And likely, worse, it tends to systemically encourage underinvestment. This ‘short-termism’ problem is caused by the capital charge—which generally refers to the cost of capital times the amount of investment—being based on net depreciated assets. So new assets appear very expensive in the early periods of the forecast, often causing the EVA contribution to be negative. Then as assets depreciate over time, EVA tends to rise, giving the illusion of value creation. This depreciation problem exists for return measures like ROIC and ROE too. Perhaps the greatest evidence of EVA’s ineffectiveness, though, has been that nearly all companies that adopted the measure in its heyday in the ‘90s ultimately abandoned it.1
To improve the recognition of value creation, we developed residual cash earnings,2 or RCE, which is similar to EVA, but simpler, and does not penalise performance with depreciation charges.3 We calculate RCE as gross cash earnings, which is essentially after-tax EBITDA, less a capital charge on gross undepreciated assets. In contrast to EVA, RCE tends to show earlier positive performance indications from new investments, without any upward drift over time, since depreciation costs are removed. What is more, our recent research has shown that, in all non-financial industries, improvement in RCE relates to total shareholder return (TSR), as a proxy for value creation, better than improvements in EVA.4
Once management teams have a credible forecast for each value centre’s RCE, the objective should be to prioritise investment in the ‘value creation engines’; that is, the businesses, regions, or markets where one expects to deliver the most improvement in RCE per dollar of investment. Again, this is just like picking stocks that one expects to yield strong growth. In a multi-business company, corporate leaders should challenge the managers of these value creation engines to be creative in finding ways to deploy more capital, innovation, and marketing investment. Indeed, one of the common causes of underperformance is underinvestment in a company’s best business lines or markets. Sure, it is easy to play it safe with conservative investment plans; but this consistently, and predictably, leads to suboptimal results. In a study titled, ‘Don’t Waste Time on Poor Performers’,5 we showed that $100 invested in top-quartile S&P 500 stocks would have created more than ‘twenty times as much TSR than that destroyed’ by the bottom-quartile stocks, over a 10-year period.
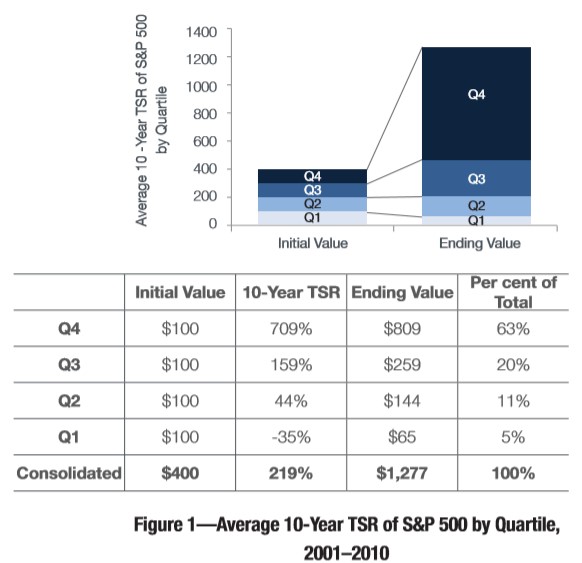
While this analysis applies to the members of the S&P 500, it is a good analogy to the circumstances faced by most large companies with a portfolio of different businesses. So, if there is one takeaway from this article, it should be that the opportunity cost of not achieving incremental growth in a promising business is likely to substantially dwarf that of failing to turn around weaker-performing businesses.
So, companies should seek to redirect resources from ‘cash-generation engines’, those with weak RCE-improvement prospects, to the value creation engines that are likely to sustain significant profitable growth and thus buoy aggregate company performance over time. Of course, one must be careful to avoid throttling these businesses, or they might experience sharp declines in performance, like that seen by Kraft Heinz earlier this year. But since one should not expect much growth from cash-generation engines, investments should most often be focused on improving cost efficiency, profit margins, and capital productivity, so that their cash flows can support future growth in value creation engines. As one of our clients recently said, “It’s okay to lose market share in such businesses, as long as we maintain or grow share in the businesses where we aim to win.”
Understanding the Sources of Value Creation
When evaluating the appeal of value centres, it is not enough to just know the financial performance; it is also crucial to examine and understand the factors that drive RCE growth. The two primary conditions needed for value creation are market attractiveness and strategic position. Market attractiveness refers to the size and growth of the market for a particular product or service. Naturally, not all markets are alike. Growing revenue in a fast-growing market is like being chased by wild animals in an open field, where there is plenty of room to manoeuvre. But growing in a flat market is more like being chased by the same animals through a narrow, dead-end alleyway.
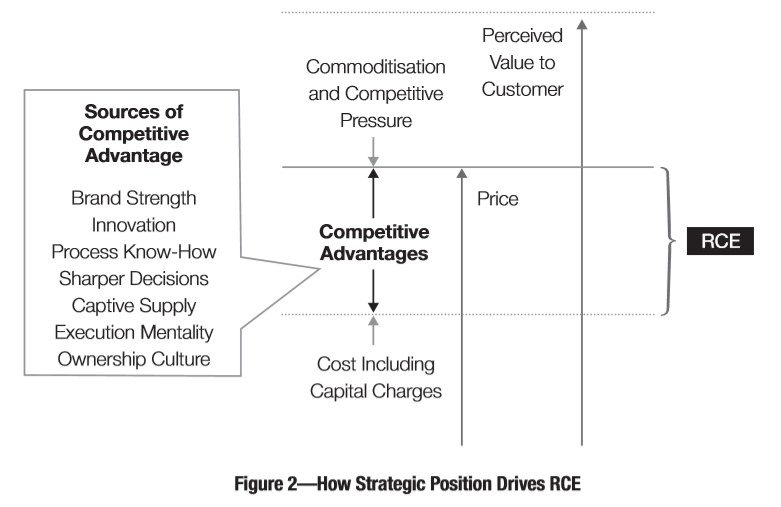
Strategic position refers to the competitive standing against other market participants, on dimensions such as brand or technological differentiation and other competitive advantages, as shown in Figure 2. A brand is differentiated when consumers perceive it as unique and meaningful, and are willing to pay a premium for its products or services. Differentiated technologies can provide user functionality that is unavailable from competitive products, as can be seen in some software applications, high-end electronics, and premium-class automobiles, to name a few examples. Cost benefits can be competitive advantages too; however, they will endure only if the cost advantage cannot readily be replicated, so differentiated products and services tend to be more sustainable than cost advantages.
Size of the Prize
In one recent client engagement, we constructed a top-down reallocation of resources, shifting significant investment capital from the client’s cash-generating engines to its value creation engines. The value creation upside was so significant that each dollar reallocated created $2-3 of incremental net present value, or NPV, which is quite significant. Suffice it to say, underinvesting in winners results in untold sums of foregone value for far too many companies.
Once these steps have been taken, a clear line of sight into value creation can be established. Not only will this help direct resources to their best uses, but also alleviate headwinds from internal politics and bureaucratic slowdowns. And once such practices are integrated into business processes, maximising value creation tends to become second nature—as the straightforward objective that it should be. Indeed, every aspect of planning and investment decision-making can, and should, benefit from strategic resource allocation.
References
1 O’Byrne, Stephen F. ‘Why Capital Efficiency Measures Are Rarely Used in Incentive Plans, and How to Change That’. Journal of Applied Corporate Finance 22, no. 2 (Spring 2009): 87-92.
2 Milano, Gregory V. ‘Postmodern Corporate Finance’. Journal of Applied Corporate Finance 22, no. 2 (Spring 2010): 48:59.
3 Milano, Gregory V. ‘Beyond EVA’. Journal of Applied Corporate Finance 31, no. 3 (Summer 2019): 116-125.
4 Milano, Gregory V. ‘Beyond EVA’. Journal of Applied Corporate Finance 31, no. 3 (Summer 2019): 116-125.
5 Milano, Gregory V. ‘Are you Wasting Time on Poor Performers?’ CFO.com, July 8, 2011. https://fortuna-advisors.com/2011/07/08/are-you-wasting-time-on-poor-performers/
*This article is published here with permission from Indian Management.
