Gregory V. Milano, Arshia Chatterjee, and David Fedigan
This is the second article in a four-part series on what drives success for shareholders in technology industries.
Many investors, analysts and journalists seem obsessed with profit margins. One security analyst wrote, “After working as an analyst myself for 20-plus years now, I’m prepared to say that if I had to make investment recommendations based on just a single series of numbers, I would definitely choose gross margin.”
Others feel it is better to move down the income statement and look at operating profit margin or EBITDA margin (that is earnings before interest, taxes, depreciation and amortization). After all, gross margin simply measures revenue less the cost of goods sold without regard to other costs and expenses.
Do these margin measures provide useful signals to managers and investors?
In the first article of this series, we described our capital market research study and explained how some of the common wisdom on the benefits of investing in growth and buying back stock doesn’t hold up against the facts of how investors actually value technology companies.
Despite the fascination with profit margins, our evidence suggests these measures don’t tell us much about success for shareholders. In our study, high-gross-margin technology companies produced a median gross margin of 75.6% and delivered median total shareholder return of 13.2%. This is a paltry 2.5% of additional annual TSR versus the low gross margin group, which had a median gross margin of only 14.6% and TSR of 10.7%.
Because operating profit margin reflects a more complete cost structure, many believe that measure is better than gross margin. But our findings say otherwise. The high- operating-profit-margin technology companies produced median operating profit margin of 24.8% and delivered median TSR of 13.5%.
The low operating-profit margin-group had median operating profit margin of only 3.7% – over 20% lower than the high group – yet it had a median TSR of 11.7%, only 1.8% lower than the high group. If anything, operating profit margin seems to be a worse indicator of success for shareholders than gross margin.
There’s also trend toward using cash-flow metrics instead of profit measures. Perhaps the most common such metric is EBITDA, and many investors and security analysts use EBITDA and EBITDA margin as important investment- analysis tools. In our research, however, we found EBITDA margin to be worse than both gross margin and operating profit margin as an indicator of success for shareholders in technology companies.
The high-EBITDA-margin companies produced a median EBITDA margin of 31.5% which is substantially higher than the 8.0% produced by the low-EBITDA-margin group. As desirable as this seems, the low EBITDA margin companies had a better median TSR, at 11.9%, versus 11.5% for the high-EBITDA-margin technology companies.
Why do gross margin, operating profit margin, and EBITDA margin so poorly measure performance for technology company shareholders?
The common weakness is that none of them recognize the amount of investment required to produce the results. Investors expect a return on their investment so that companies that can produce the same margin with less capital investment will often be viewed more favorably by shareholders. That’s not to say being capital-intensive is bad. It just means a higher margin is necessary to make up for the “cost” of being capital-intensive.
To incorporate margin and capital intensity into one measure is typically done using rate of return measures. In our research, the return measure that best distinguished performance for technology company shareholders was return on equity (ROE). ROE is simply defined as net income divided by the book value of equity. The high-ROE technology companies had a median ROE of 21.6%, which is much higher than the 2.2% median for the low-ROE companies.
More importantly, the median TSR of the high-ROE companies was 18.5%, a whopping 13.0% higher than the low-ROE company median of 5.5%. TSR performance is far more sensitive to ROE than any of the profit margin measures, making ROE an important operating performance indicator for both managers and investors in technology companies.
Unfortunately, despite these fine results, focusing only on improving return measures can lead to undesirable behavior. Managers in strong businesses that are rewarded based on improving rates of return often underinvest because it is hard to find investments that will increase the average return when returns are already very high. Conversely, managers in weak businesses often over-invest because it is easy to find investments that will increase the average return when returns are already very low. Therefore, it is essential to balance growth and return.
As part of our research, we built a three-by-three matrix with the companies sorted into high, medium, and low growth and high, medium, and low ROE. (See B As expected, the technology companies with high growth and high ROE had the best median TSR and those that were low on both dimensions had the worst TSR. From any starting point on the matrix, improving growth or ROE to get to the next box always shows better median TSR.
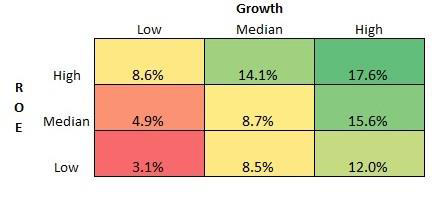
Perhaps the most interesting finding is that growth seems to be slightly more important than ROE for technology companies. Those with high growth and low ROE had median TSR of 12.0% which is higher than the 8.6% median TSR for those with high ROE and low growth.
This research shows that rate-of-return measures, and in particular ROE, are meaningfully better indicators of success for technology company shareholders than any of the margin measures we tested. Managers and investors should pay less attention to margin measures and would be better off using return measures such as ROE, alongside revenue growth, in order to evaluate tradeoffs and make strategic investment decisions.
