Although some of the success since 1980 can be attributed to declines in the homicide rate and
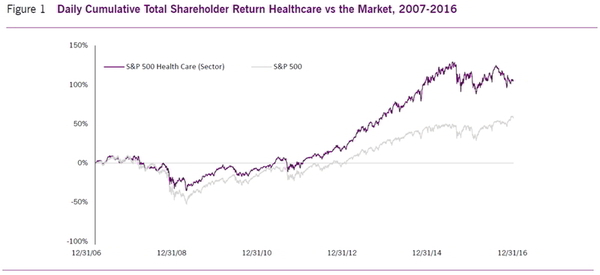
the rate of motor vehicle-related deaths, the vast majority of the improvements have come from better healthcare. Despite the continued challenge of diseases, injuries, and other conditions that shorten or reduce the quality of life, the healthcare sector has been extremely effective in achieving important medical advances and improving human health. While many investors might feel good about owning virtuous businesses, their primary objective in owning the shares of healthcare companies is realizing decent long-term returns in the form of share price appreciation and dividends. In other words, investors want their companies to deliver a high “total shareholder return,” or “TSR” for short. The good news is that, when it comes to the healthcare sector as a whole, the goals of owning companies with such clearly visible social benefits and earning competitive returns on investment don’t seem to be mutually exclusive. As can be seen in Figure 1, over the ten years from 2007 through 2016, the S&P 500 Healthcare Sector generated a cumulative return that was nearly double the overall S&P 500 (105% versus 58%).
There are numerous strategies, policies, and tactics that can be employed by corporate management to drive longterm success for shareholders. But if we had to sum it up in a word, it would be “differentiation”-differentiation based on a company’s competitive advantages. Depending on the industry or company situation, differentiation can come from different forms of competitive advantage. For example, innovative products and services that are better than other competitive offerings in the eyes of customers can provide growth and pricing advantages that are very valuable to shareholders.
In other companies, differentiation comes from cost efficiencies and capital productivity that result from state-ofthe-art manufacturing processes and distribution networks. The benefit of such differentiation is that it creates and protects a company’s ability to make promising investments in growth without the fear that competitors will drain away its cash flow, profit, and returns.
With the aim of achieving a better understanding of the reasons for this disparity, we undertook a comprehensive review of how differences in capital deployment strategies, financial policies, and performance measures are associated with, and likely to contribute to, differences in performance for shareholders. To this end-and with the generous support of a few healthcare companies-we recently completed the Fortuna Advisors 2017 Healthcare Shareholder Value Project (the “project”).
We have completed many such studies since starting Fortuna in 2009, and their findings have often alerted us to notable differences between the conventional wisdom about what drives long-term stock performance and what we actually observe in the market. And it’s not just managers who misunderstand what markets are doing. Sometimes, even investors appear to be getting it wrong. For example, executives often describe heavy pressure from investors to buy back stock and reduce share count. Following this advice tends to reduce the number of shares outstanding, which makes almost every metric look better on a “per share” basis. And many, if not indeed most, corporate managers expect these mostly cosmetic EPS effects to drive a company’s share price higher.
But the longer-run consequences of “events” like buybacks can sometimes be quite different from the expectations created by the market’s initial reaction, and thus what may be an initial “pop” in a share price often turns out to be misleading. The reality is that, in the case of healthcare, companies buying back more stock tend to have lower TSR over the longer term. We later suggest some potential reasons for this, but our point in citing this example is simply that there can sometimes be differences between what investors do, and what they believe or say they do.
Capital deployment is one of the most important responsibilities of senior executives and the board. And so fact-based analysis of how capital markets respond to corporate investments and operating performance should be combined with careful strategic decision-making when determining the best uses of corporate cash and capital. Is it investing in research and development, making acquisitions, or buying more property, plant & equipment? And along with such investments-or instead of them in some cases-should companies be paying dividends, repurchasing stock, building cash, or paying down debt? Should a company build financial flexibility or lever up with tax-deductible debt to reduce its weighted-average cost of capital? Should a company pursue acquisitions or stick with organic investments? These are but a few of the many important questions on which we attempt to shed some light using our sector-level empirical evidence. In the pages that follow, we summarize our findings about what investors do by comparing the relationship between TSR and various traditional and bespoke metrics. Some of these bespoke metrics tend to do a better job of relating the concept they’re intended to measure to TSR. For example, we use reinvestment and distribution “rate” metrics, which are defined as the capital deployment item-for example, annual spending on R&D, capex, dividends, and so forth-divided by a measure of economic or cash profits that we call Gross Cash Earnings (GCE). As discussed later, GCE is after-tax Earnings Before Interest, Depreciation, Amortization and R&D.
We use these reinvestment rates instead of the standard practice of normalizing as a percentage of sales not only because they “test better” in capital market research (as they do in this study), but also because these metrics have a behavioral advantage over the percentage of sales metrics used in most studies and companies. One effect of calculating and using metrics scaled by cash profits instead of sales is to encourage greater investment as a percentage of sales in more profitable businesses and to reduce investment in less profitable businesses.
Before summarizing the findings of our study, we start by explaining our research methodology and how our unique approach cuts through the “noise” that often makes it difficult for practitioners to interpret and make use of the findings of capital market research. Next, we provide an overview of the most important sector-wide relationships between TSR and various corporate operating and financing metrics, as well as insights into how some of these relationships vary among the subindustries of biotechnology and pharmaceuticals. Last, we discuss how these findings can help healthcare companies identify and possibly implement performance measures that provide a clearer and stronger link between operating performance and TSR, make better capital deployment and distribution decisions, and set financial policies that support strategies that drive long-term shareholder value. Fact-based analysis of how capital markets respond to corporate investments and operating performance should be combined with careful strategic decision-making when determining the best uses of corporate cash and capital.
When it comes to the opportunity to differentiate, it’s hard to imagine an industry better positioned than healthcare. From biopharmaceuticals and gene therapy to artificial organs and limbs, there are a myriad of cures and treatments becoming available for conditions we once viewed as terminal or permanent. And the sector is making progress in fighting big health threats like cancer and heart disease, too. With focused strategies, companies can specialize and address important health challenges in areas previously untouched, bringing differentiated value and longer life spans for many. When we consider these advances-together with the economic value created-in the context of the hierarchy of consumer needs, it’s difficult for even a social media platform or a more fuel-efficient car to compare.
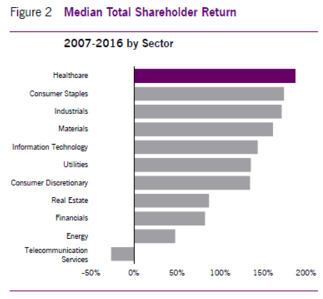
It’s true that the healthcare sector hasn’t always been the most efficient or productive, and the resulting failure of large parts of the industry to earn competitive returns on capital has weighed on financial performance at times. But as shown in Figure 2, during the past ten years the overall success of healthcare companies in developing new products and services, and the importance of that success to the public, have led to more value creation for shareholders than in any of the other major sectors. But averages and medians can hide a lot of inefficiency and poor performance, and a careful examination of the sector shows a sizable disparity between the shareholder performance of the top companies and the rest.
How We Conducted Our Research
We studied a sample of approximately 100 companies, including all the healthcare constituents of the Russell 1000 that had full data availability across the entire time period of the study. This sample includes many different business models and market exposures.To capture both medium-term and long-term relationships, our study incorporates 16 years of data, using 52 rolling three-year periods, with each three-year period rolling forward one quarter starting with Q4 2003. A rolling three-year period reflects a reasonable timeframe in which investors and management teams expect changes and new strategies to take hold, while allowing sufficient variation in the metrics whose effects on TSR we are trying to identify to reach some statistically meaningful conclusions. The 16-year time span includes more than an entire business cycle, as well as market and sector peaks and troughs, while ensuring sufficient data availability.To identify relationships between a particular metric and total shareholder return (TSR) across rolling periods, our study uses an analytical technique that entails three steps. First, companies are sorted into high, medium, and low “tertiles” on a given dimension for each rolling period. Second, the high, medium, and low tertiles are combined across all rolling periods into three overall high, medium, and low groups. Third and last, the median TSR is calculated for the companies within each group.
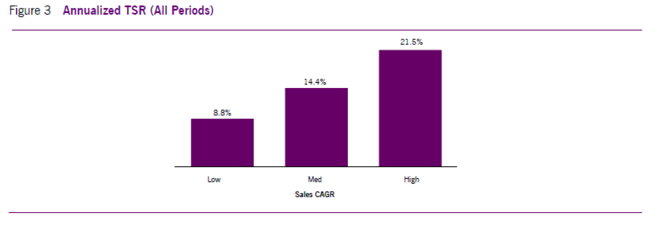
The differences between the median TSRs of the high and low groups are used to identify both the magnitude and direction of a variable’s potential impact on TSR. For example, as shown in Figure 3, when we examined the difference between the High and Low group for the compound annual growth rate in sales, or “Sales CAGR,” the TSR impact was a positive 12.7% (21.5% less 8.8%). This “law-of-averages” approach cuts though the noise and mood swings of the market that often cloud or make it hard to interpret the findings of traditional analytical methods such as regression analysis. We find that this method is not only directionally accurate in its conclusions, but easy to understand for operating managers not well versed in the nuances of statistics. As one executive summed it up, “so you are comparing the median TSR of all the companies that did a lot of something to the median TSR of those that did very little of it.” Exactly.1
Overall Healthcare Sector Findings
Perhaps the most intriguing findings are those that are at odds with “typical” management priorities or common beliefs about what drives TSR. These beliefs are often a legacy from what has worked or seems to have worked in the past. Over time, these legacy beliefs often assume the status of “self evident truths” that are widely believed to hold under any and all market conditions.For example, as a result of numerous academic studies of the typical share price reaction to the announcement of acquisitions, many investors, academics, and commentators have concluded that, on average, acquisitions destroy value for shareholders. The findings of our study of the healthcare industry, however, suggest that companies that deploy more of the capital they generate into acquisitions actually tend to have higher median TSR over time. Investors may have often reacted negatively when acquisitions were announced; but over longer periods of time, such as the three-year periods evaluated in our study, the shareholders of acquiring companies have tended to benefit more than investors in their less acquisitive competitors.Our most important findings can be summed up in the following four main themes:
1. Reinvest in Innovation and Growth: Although the stock market is often characterized as focused on the short term, higher reinvestment, especially in the form of spending on R&D and acquisitions, is positively associated with TSR.
2. Financial Flexibility is More Important than Leverage: Maintaining financial flexibility by reducing net debt, sustaining an unlevered capital structure, and even increasing the number of shares outstanding are all associated with higher TSR in the healthcare industry. Our findings show that healthcare companies with higher debt levels tend to have lower TSR.
3. Focus on and Measure Continuous Improvement: It’s not enough just to be good; it takes growth and improvement in operating performance to drive TSR. That’s why measures of change in performance such as ?EBIT, EBITDA CAGR, ?ROIC (return on invested capital), and Sales CAGR all show consistently strong and positive relationships to TSR while measures of levels of performance, such as EBITDA margin and EBIT margin, demonstrate at best weak or, in some cases, even inverse relationships.
4. Distributions Do Not Drive TSR: Despite investor demands to pay dividends and buy back shares, for healthcare as a whole these distributions actually have a strong inverse relationship with TSR. That is to say, the larger the payouts to shareholders, the lower the shareholder returns.
Reinvest in Innovation and Growth
Of all the measures of capital deployment that we looked at for healthcare companies, the one with the strongest positive in R&D. The median TSR for the high R&D reinvestment group was 6% higher per year than that of the low group, and this relationship is fairly consistent through time. What’s more, high R&D Reinvestment Rates are also associated with higher forward price-to-earnings multiples, higher forward EBITDA multiples, and price-to-book value multiples that are both higher and expanding.
Brokerage analysts and others typically describe companies as heavy R&D spenders when they have high R&D-to-sales ratios. But as mentioned earlier, instead of following the standard practice of evaluating R&D reinvestment as a percentage of annual sales, we define the R&D Reinvestment Rate as R&D spending as a percentage of Gross Cash Earnings (GCE), which is earnings after taxes but before interest, depreciation, amortization and R&D.
And it’s also worth noting-and, we would argue, strategically significant-that the R&D Reinvestment Rate when measured as a percentage of GCE reveals a stronger and more consistent relationship (+6.0%) with TSR than when R&D expense is measured as a percentage of sales (+3.9%). When allocating resources, it’s much more effective for companies to compare resource utilization across different business units, and in comparison to peers, based on a reinvestment rate that is expressed as a percentage of GCE than to allocate or benchmark anything as a percentage of sales.
Along with the R&D Reinvestment Rate, two other capital deployment ratios also showed a strong positive relationship to TSR. Both the Total Reinvestment Rate, which includes R&D, acquisitions, and capex as a percentage of GCE, and the Gross Cash Acquisition Reinvestment Rate, defined as gross acquisitions as a percentage of GCE, were associated with 3.3% higher TSRs per year. But at the same time, and somewhat surprisingly, the Capex Reinvestment Rate-measured as investments in property, plant and equipment-actually showed a negative relationship of -2.1% per year. So while capital expenditures are often viewed as less risky than investments in R&D and acquisitions, our research shows that healthcare companies that emphasized R&D and acquisitions performed much better than those that emphasized organic capital investment.
One possible explanation for the poor performance of the companies with more capex is that such investment often takes place after the release of information related to some of their key drivers of long-run profitable growth, such as drug approvals, increased patient or physician interest, and entry into new markets. In other words, the benefits of such capital spending may already have been well recognized by the market.
In healthcare, because R&D is an important driver of differentiation and long-term success, we view R&D as an investment that, despite its accounting treatment, is fundamentally no different than the capital expenditures and acquisitions that are recorded on corporate balance sheets. The accounting convention of expensing R&D spending in the year it takes place not only distorts the performance measures used by many investors, but may also encourage short-term thinking by management teams. Earnings-driven executives might be tempted to squeeze their R&D budgets, or at least not increase them as much as they should, to meet quarterly and annual earnings objectives.Our findings suggest that this would be short-sighted: in such a high-growth, value-creating sector, sacrificing the future to deliver current earnings is a prescription for lower, long-run TSR. The stock market tends to reward healthcare companies that reinvest in their longterm health by increasing R&D.
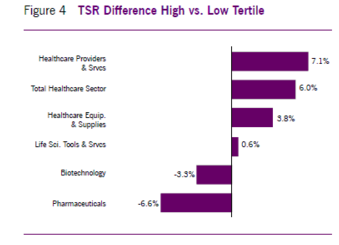
Nevertheless, it is important to recognize that this relationship does not apply to all the subindustries that we studied (see Figure 4). The strong showing from R&D may reflect the overall success of the biotechnology subindustry, which has both a much higher R&D Reinvestment Rate than the other healthcare subindustries and the highest median TSR. But contrary to what one might expect, pharmaceuticals actually demonstrate a negative relationship between R&D reinvestment and TSR.2
And even more surprising, so does biotech, even though as a group it has both the highest R&D Reinvestment Rate and the highest TSR of all the subindustries. The likely explanation for this finding is that the mix of highly profitable and unprofitable companies that is included in the same biotech industry makes the data less statistically significant. We believe that further work separating biotech companies into two groups-those “already profitable” and those “not yet profitable”-would provide helpful clarification.
The answers to both the biotechnology and pharmaceuti-cal conundrums may reflect investors’ skepticism about the productivity and expected return of the companies’ R&D investments. In an attempt to quantify such productivity, we developed and tested a measure called “Reinvestment Effectiveness,” which we define as the change in the company’s revenue as a percentage of Total Reinvestment during the period. Our finding that biotech and pharma ranked lowest among all healthcare groups in the median value of their Reinvestment Effectiveness may go a long way in explaining why higher R&D investment is associated with lower TSR for both subindustries.
At the same time, our finding that both biotech (+14.9%) and pharma (+10.1%) show a strong positive relationship between Reinvestment Effectiveness and TSR-one that is significantly more positive than in the other subindustries- supports our view that most biotech and pharma companies don’t get enough growth per dollar of R&D to justify their investment of capital. But what this and our other findings also tell us is that, although such companies as a group don’t generate as much average revenue per dollar of investment, those biotech and pharma companies that do achieve high Reinvestment Effectiveness significantly outperform not only their competitors, but also most of the best performing companies in other parts of healthcare.
What explains this lack of R&D effectiveness that reduces the returns of the average biotech and pharma companies? Our best guess is that the increasing complexity of the science and intense regulatory environment have made it difficult for pharma companies to reinvest effectively, leading to lower average TSR for pharma companies with higher R&D Reinvestment Rates. To the extent this is true, this negative relationship of R&D reinvestment to TSR may reflect not only the market’s skepticism about the value of R&D in these subindustries, but the difficulty of reinvesting effectively and the high degree of risk associated with such investment.
What’s more, the large pharma companies may spend so much on R&D that it is difficult to be efficient enough to earn an adequate return on investment. During the five years that ended in 2016, the collective investment in R&D of the five largest U.S. pharma companies was almost $160 billion-an amount that exceeds the annual GDP of about 70% of the United Nations member countries. And given such mega budgets, these companies may spend more to achieve each research milestone because they are more comprehensive in their research project planning, employ more overhead in support of the research staff, and may have higher direct cost structures as well. There is also the possibility that their smaller biotech brethren not only spend less but may be more focused on results, including return on investment, especially since the viability of their firm often depends on achieving success.
This is not to suggest that the smaller firms cut corners, but rather that, to conserve resources, they may be quicker to cut spending on unproductive testing and trials. What does this mean for the investment strategies of the large pharma companies-and also for the larger biotech companies that are growing their R&D budgets and looking more and more like pharmaceutical companies?
Maybe they would be better off investing less in R&D and instead waiting to acquire the smaller firms once they are pretty far along in their R&D process. In support of this argument, we find that the pharma companies in the high Net Cash Acquisition Reinvestment Rate group have median TSR that is 5.7% higher than the low group. And in biotech, the significant acquirers have 12.6% higher TSR. Both of these figures are meaningfully higher than the 3.1% TSR advantage we see across all of healthcare, indicating that pharma and biotech companies generally create significant value through acquisitions.It is not hard to see why these companies are such effective acquirers. The “skinny” business model that makes the smaller companies more effective at research brings with it a general shortage of commercialization skills and distribution scale. But such skills and scale are, of course, the core strengths of the industry behemoths. Whereas a small biotech company would need to give away a substantial portion of its economics to achieve meaningful distribution, the large pharma company merely drops a new drug or treatment into its existing network with far less incremental cost. And the result tends to be greater scale, faster growth, and more cash flow and profit.
Even if acquisition prices rise to levels that look exorbitant in relation to the cash flows of the standalone company, there is often plenty left over for the acquirers’ shareholders. It should be noted, however, that the success of healthcare acquisitions is highly variable, with many disappointing deals along with the wins. And this variability in turn means that an effective strategy requires a portfolio of acquisitions. But for those pharma and large biotech companies that do many acquisitions and take this portfolio approach, our research shows that such active acquirers have produced, on average, meaningfully higher TSR. And this finding suggests that the successes must have been more than adequate to make up for the disappointments.
Financial Flexibility More Important Than Leverage
Many investors and capital market commentators seem to view debt financing as a contributor to shareholder value. The basic formula for the weighted average cost of capital that is taught in business schools shows a firm’s cost of capital declining with increasing leverage as a result of the tax deductibility of interest payments. And the resulting reduction in the cost of capital is viewed as increasing the present value of future cash flows and share prices. However, our research suggests that, in the healthcare industry as a whole, the financial flexibility afforded by low-debt capital structures outweighs the benefits of leverage. Companies in the Low-Leverage group-with leverage measured by their ratios of net debt to debt plus book equity-produced median annual TSR that was 5.1% higher than companies in the High-Leverage group. And companies in the High Debt-Paydown group-with debt paydown measured as the net reduction of debt as a percentage of debt plus equity-had 7.2% higher median annual TSR than the Low Debt-Paydown companies.
Given the major role of reinvestment in driving TSR in healthcare, our findings seem reasonable and consistent. In a sector with such large and promising organic as well as outside investment opportunities, maintaining the financial flexibility to be opportunistic in making these investments appears to have been quite valuable.
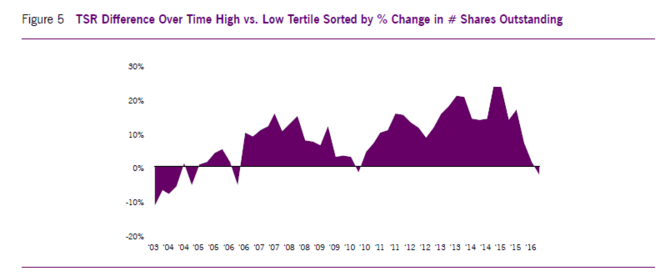
Moreover, in what is perhaps the most astonishing finding of the study, High Net Issuers of Shares showed the largest positive TSR benefit in the financial policy category. The companies ranking highest in the percentage change in their number of shares outstanding experienced both significant increases in their share counts and median TSR that was +9.0% per year higher than the low issuance group, which saw an average decline in their outstanding shares. What’s more, as can be seen in Figure 5, this relationship between equity issuance and higher share returns has been remarkably consistent during the last ten years.
Our interpretation of this finding is not that raising equity and increasing the share count creates value in and of itself. Rather, it is what the companies’ decisions to issue equity tell investors about the companies’ investment opportunities- the drugs, products, indications, or consumer markets that investors expect the proceeds from the new issuances to fund-that really drives the increases in value. The positive value of these investments seems typically to be much greater than any negative impact from share count dilution. And for the many managers and investors who view shareholder dilution as something to be avoided at almost any cost, this finding is likely to be surprising. But the lesson here is clear: managements and boards should not be overly concerned about the dilution associated with raising equity as long as what they plan to do with the proceeds is worth it.
When viewing these findings on dilution together with the earlier discussion of acquisitions in pharma and biotech, we see a potential bias among early-stage companies, both public and private, that may have led their shareholders or owners to leave considerable value “on the table.” Development-phase companies require capital to fund research, testing, trials and commercialization activities. For such companies, there are two basic alternative sources of capital: either issue shares that dilute existing shareholders, or enter into a so-called “big brother deal” with a large pharma company that provides funding in exchange for contractual distribution rights.
In the most successful cases, big brother deals tend to lead to future acquisitions, which we know tend to be positive for pharma and biotech companies. It is clear why big pharma is interested in such transactions. But what about the small developing companies? In at least some cases, the management teams and boards of development stage companies are so fearful of the effects of dilution on their reported EPS that they are willing to sign up for big-brother deals even when the economics are much worse than simply issuing shares to fund their investment. For those management teams highly confident about their companies’ prospects and opportunities, our findings should improve their ability to evaluate the advantages of these competing sources of funding and so make better decisions about what is in the best interest of their shareholders.
Focus on and Measure Continuous Improvement
Despite our admiration for companies with high profit margins, our capital market research shows that healthcare companies with high margins tend to have worse share price performance than their lower-margin competitors. One would expect that these great companies should be great stocks-but in reality they usually are not. This may reflect the difficulty in sustaining high performance because when everything is running well, it seems that more things can go wrong than right. Indeed, successful high-margin companies may succumb to cost management complacency; and by failing to control costs and maintain discipline in their capital spending, they may end up earning disappointing returns on capital.But even without a cost and capital management problem, high-margin companies often face pricing pressure because their high margins attract competition. When other companies develop their strategies, they consider the proven profitability of different therapeutic areas and often target areas where profits are high.As we have seen in our studies of other industries, it’s not the level of performance that matters to investors in healthcare; it’s the rate of improvement and growth in performance. Those businesses that manage to improve their margins tend to have stronger share price performance. This category can include those companies that have been humbled by failure and are getting back on their feet. It’s often companies that are generating improvements and growth that are the most open to changing operating and business management processes instead of sticking with “how things have always been done.” But the critical point here is that health care executives must recognize that being a high-margin company doesn’t guarantee a high share price. It’s continuous improvement that matters most. Is this year’s performance better than last year’s?
The contrast between the effects of “levels of ” and “improvements in” operating performance on share returns is most visible in the case of earnings before interest and taxes (EBIT) margin. In fact, the improvement in EBIT Margin showed the strongest positive relationship with TSR of any variable we tested in the capital deployment, financial policy, or performance measurement categories. The median annual TSR per year of the high ?EBIT Margin group was an impressive 14.8% higher than that of the low group. At the other end of the spectrum was the level of EBIT Margin. The high EBIT Margin group had median annual TSR that was actually 4.4% lower than that of the low EBIT Margin group. A similar contrast between the level of and improvement in performance can be found in the case of earnings before interest, taxes, depreciation and amortization, or EBITDA. Whereas the high EBITDA CAGR (compound annual growth rate) group had median annual TSR that was 13.5% higher than the low group, the high EBITDA Margin group had median annual TSR that was -5.3% lower than the low EBITDA Margin group.
Decades ago, it seemed more important to grow the top line than to be profitable. There was a resurgence of this mindset during the tech bubble of the late 1990s. For the most part, it has become more common these days to emphasize margins and returns over sales growth. Nevertheless, we find in most industries that companies with higher sales growth rates do tend to have better share price performance. So one of the main goals of our work since founding Fortuna Advisors has been to demonstrate the importance of growth, together with cost efficiency and capital productivity, in creating shareholder value. Confirming the importance of sales growth in healthcare, our study found that the companies in the high Sales CAGR group had median annual TSR that was 12.7% higher than that of the low growth group. This finding is also consistent with the importance of reinvestment rates that we reported earlier.
Ranked closely behind the positive effect of sales growth on TSR is the effect of improvement in returns on invested capital, or ROIC. The high ?ROIC group had median annual TSR that was 12.4% higher than the low group. The fact that ?ROIC ranked behind ?EBIT Margin and EBITDA CAGR is a bit troubling since the EBIT and EBITDA measures do not take into account the amounts of underlying investment. And as a general rule, we recommend that healthcare companies emphasize ROIC, and return measures generally, instead of EBIT and EBITDA, since we believe the behavioral benefits of balancing revenue, cost, and capital far outweigh the modest apparent difference in TSR implications. The effect of the level of ROIC on TSR was essentially neutral, with the high ROIC group having median annual TSR that was 0.5% higher than the low group. Although the level of ROIC performed worse than ?ROIC, at least it was not significantly negative, as in the cases of the levels of EBIT and EBITDA margins. This further reinforces the case for using ROIC instead of EBIT or EBITDA as an important measure of corporate performance.
As suggested earlier, we often find that executives who focus on margins take their eye off of capital productivity. At the same time, those who focus on capital productivity tend to take their eye off of margins. By aiming to increase ROIC, or another suitable return measure, management is encouraged to manage and optimize both margin and capital productivity. Managers should be willing at times to accept a decrease in margin, for example, when they enter a new business that is very capital light, as long as the new business activity has enough margin to more than overcome the costs associated with the capital intensity. But as mentioned, an excessive focus on ROIC often leads management to sacrifice profitable revenue growth. If management wants to improve TSR, as we will demonstrate below, it must simultaneously manage both growth and return.
To develop an integrated business strategy requires important decisions on capital deployment, resource allocation, and financial policies. And the approach to performance measurement and incentives must be consistent with and work to reinforce the strategy Strategy is often thought of mainly in terms of how to position the company within the landscape of customers or patients, competitors, suppliers, and regulators. Successful strategies guide companies in developing and applying their competitive advantages to deliver exceptional benefits to society and realize outstanding benefits for the company and its shareholders. When making strategic tradeoffs, management determines which products and services to develop, where and how to market and distribute them, and how to build the most effective organization to deliver results.
For the majority of healthcare companies, R&D is a major driver of success, so strategies should revolve around R&D, the pipeline, and the ongoing commercialization of what comes out of the pipeline. And for those companies whose R&D strategy is at the heart of their business strategy, care should be taken to ensure that performance measures and incentives don’t penalize management for increasing R&D spending. One company we met with recently said they use EPS as the primary measure in their incentives. They claimed that management does the right thing and makes appropriate R&D investments, which may very well be true. But why have a performance measurement and incentive framework that managers have to overcome in order to make the right decision? Do we really want managers to have to accept lower bonuses as a condition of doing what is right for shareholders?
But at the same time, managers shouldn’t get a free ride on R&D spending. And since we consider R&D to be an investment, our performance measures are designed to encourage companies to treat historical R&D spending as an asset. In this way we take the pressure off during the year the R&D funds are invested, but at the same time hold management accountable for delivering a return on that investment over time. This helps management make the value-maximizing tradeoffs between growth and returns.
Distributions Do Not Drive TSR
The biggest inconsistency we find between what investors say and what they do involves distributions. Despite seemingly endless investor demands for dividends and buybacks, the capital deployment metric with the worst TSR relationship in healthcare is the Total Distribution Rate, which combines dividends and stock buybacks. As we noted earlier, the companies in the high Total Distribution Rate group had median TSR that was 7.3% lower per year than the median company in the low group.Although there is active debate on whether buybacks support share price performance, many finance experts claim that, at least for large mature companies, dividends are good for shareholders. So it is fascinating that the Dividend Distribution Rate had an even slightly more negative implication for shareholders (-7.2%/year) than the Net Buyback Distribution Rate (-6.7%/year), which reflects buybacks net of share issuance. In the healthcare sector, both kinds of distributions are associated with significant underperformance. Interestingly, the Gross Buyback Distribution Rate doesn’t fare as badly (-0.6%), which seems to indicate that buybacks do not restrain TSR much if they simply offset dilution from executive compensation and other sources. But if the net buyback rate is high and the share count actually declines, that’s when buybacks become linked with meaningfully worse TSR. Distributions associated with drops in share count may be interpreted by investors as a sign of a major shortage of investment opportunities in the business-or they may actually cause management to turn down promising investment opportunities. Either way, such distributions are likely to be viewed as bad news by shareholders. And this finding is consistent with our earlier reported finding about the positive association between TSR and equity issuance. In other words, just as decisions to raise new equity are likely to reflect management’s optimism about the company’s investment opportunities, decisions to increase shareholder payouts are likely to reflect management’s skepticism about the value of future investment opportunities.Overall, then, while most forms of investment in healthcare are positively associated with TSR, distributions are not. This may be best understood in the context of the superior overall sector performance during at least the past ten years. During that time, as noted earlier, the health care sector has significantly outperformed the broad stock market. That was true even during the first half of 2017, when new potential industry regulation was being considered in Washington. In such a value-creating environment, putting money to work by investing in growth and innovation has led, on average, to much higher TSR than simply giving the money back to shareholders via dividends and buybacks.
Many have argued that buybacks, perhaps in combination with dividends, are the best use of capital when a company is short of desirable investment opportunities. Although this has clearly proven to be true in some other industries, its application to at least some parts of healthcare has turned out to be misguided. In too many cases, we have seen management teams set investment hurdles too high, apply overly conservative investment analyses and assumptions, underinvest in the business, and then turn to buybacks after saying they had no promising investments.
In some cases, this sequence of events is exacerbated by a myopic focus on short term EPS accretion, which almost always occurs when stock is repurchased. Nevertheless, in other research covering all industries, we have found that, on average, companies that increase their EPS through buybacks tend to suffer declines in their P/E multiples. And as a result, the increases in EPS accretion created by financial engineering (i.e. buybacks) have proved to be much less lasting or valuable to investors than the EPS increases resulting from revenue growth and improvements in return on capital.
Strategy: Seeking the Value-Maximizing Balance between Growth and Return
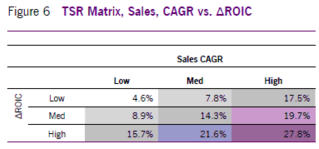
Some companies emphasize returns over growth and others do the opposite. In both cases, by leaning too much one way or the other, managements could be developing suboptimal strategies that deliver suboptimal results. The findings of our study can be used to illustrate the expected performance associated with different combinations of growth and return.The effects on TSR of both sales growth (+12.7%/year) and the change in ROIC (+12.4%/year), when considered independently of one other, rank slightly lower than the change in EBIT Margin (+14.8%/year). But when companies are sorted on both ?ROIC and sales CAGR in a three-bythree matrix, as shown in Figure 6, the positive effect on TSR expands to 23.2% (27.8% – 4.6%).When compared to any other combination of metrics we tested, including some that included the change in EBIT margin, the combination of sales CAGR and change in ROIC shows the most balanced and evenly distributed TSR effect. Regardless of the starting point, adding growth or improving ROIC can be expected, on average, to improve TSR. In fact, the average expected improvement from moving up one tertile on either growth or change in ROIC is about the same. So they appear to be similarly important drivers of TSR.
Perhaps more significantly, the TSR benefit of each metric is typically higher when the other metric is already in a “higher” box. In other words, if you are already growing fast, then improvements in return are more valuable. And if your returns are already high or improving rapidly, then growth is especially valuable. It is easy to see how this perspective can provide insights when evaluating and setting strategies for a portfolio of business units within a large healthcare company.
It’s often said that what gets measured gets done. A review of health care proxy statements seems to support this claim, showing that many companies place too much emphasis on earnings or margin performance against a plan or budget, without enough emphasis on actual return and margin improvements from the prior year. Furthermore, although many executive compensation plans incorporate revenue, they again tend to do so versus budget, and without any rigorous standard for how much growth is viewed as acceptable.
A better solution would be to have incentives driven by a two-dimensional grid based on continuous improvements in sales and returns. This way executives would be paid more in strong years, even if the performance was budgeted, and vice versa. This would free them to plan high without raising their incentive performance targets.
Residual Cash Earnings: A More Reliable Way of Balancing Growth and Returns
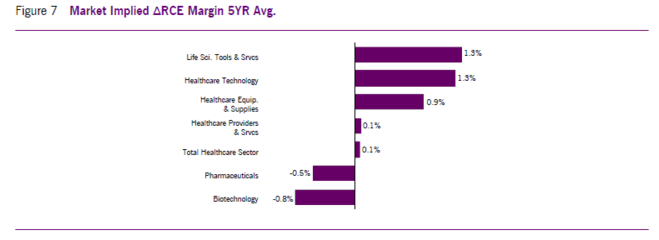
An alternative and simpler way to emphasize growth and return improvement is to apply a comprehensive cash flowbased measure of economic profit that acts as a kind of balanced scorecard between growth and returns known as Residual Cash Earnings (RCE).3 RCE is the after-tax cash earnings generated by a company or business minus a capital charge that reflects the required return on the company’s gross assets, including capitalized R&D. Although the changes in RCE tested well against healthcare TSR (+11.9%/year), its biggest advantage is from a behavioral standpoint.We have found that tying improvements in this measure to incentive compensation encourages a corporate mindset of ownership- one in which managers are rewarded for deploying capital as if it were their own. It is a very effective tool for balancing growth and return, and can be used to develop strategies, make investment decisions, and measure performance.Another important corporate use of RCE is to link corporate goals to investor expectations. Building this link starts with the fairly straightforward task of estimating the level and growth of RCE that are reflected in the company’s current stock price. For each of the subindustries of the U.S. healthcare sector, we solved for the future RCE profile that equates to their current aggregate Enterprise Value. And to make it possible to compare companies of different sizes, we divided the expected average? RCE per year by the prior year revenue-that is, the ? RCE margin.
As shown in Figure 7, investors expect and are pricing in RCE improvements in life sciences tools and services, health care technology, healthcare equipment and supplies, and healthcare providers and services. But at the same time, investors in companies in the pharmaceutical and biotechnology industries appear to be anticipating a drop in RCE. Given the patent lives of existing drugs and treatments, the pipeline of new opportunities is important to the sustainability of RCE, and the value of these pipelines may be perceived to be small or even negative, perhaps owing to the perceived shortage of profitable R&D opportunities we provided evidence of earlier. This kind of analysis can be helpful when comparing internal management plans to sector expectations and, as already suggested, when setting management goals. Whether using the combined growth and return approach or RCE, the emphasis on growth and return should inform and guide the planning, decision-making, and incentive processes. Doing so will encourage management to take a long-term perspective and ensure that it is investing enough to achieve its growth and return goals, and maintaining the financial flexibility required to execute its long-term growth strategy.
Valuation Drives the Efficacy of Buybacks
In cases where companies clearly have more cash and capital than what they need to fund both current and future valuecreating growth, buybacks should be considered. But before deciding to return capital through buybacks (as opposed to, say, special dividends), management should attempt to ensure that it doesn’t end up overpaying for the company’s stock, and thereby transfer value from its remaining to its selling shareholders.To limit the risk of such overpayment, management should insist that their estimate of the company’s intrinsic value is at least a reasonable percentage above the current share price. That percentage, or “value gap,” will vary by company, based on a number of factors, including the likely amount of alternative value-creating investments. In other words, for a company with a large number of seemingly attractive growth opportunities, the value gap threshold that must be surpassed for buybacks to be viewed as desirable should be much higher than for a company with fewer promising investment opportunities.Consideration of this value gap is important because we have found that many companies that have repurchased their stock have failed to earn a “Buyback ROI” that is commensurate with the returns shareholders could obtain by simply investing in the market. As we calculate it, a company’s Buyback ROI is its annualized rate of return based on a formula that accounts for the cash spent on buybacks, the money it saves by “avoided dividends” on the repurchased shares, and the change in its stock price after the buyback.
In analyzing the 353 companies in the S&P 500 with meaningful buyback programs, we found that the median Buyback ROI over the five years ending with 2016 was 11.2%, and thus significantly lower than the annualized return for the broader market of approximately 14.6%.4 These findings are consistent with our observation that companies tend to buy back shares at or near the top of the market, when cash flow is plentiful, and their share prices are high and potentially overvalued. We have also observed during years of advising companies that even when their share prices are high, many managements seem to view their shares as undervalued. We find that the use of a rules-based buyback strategy, based on thresholds for valuation multiples, financial flexibility, and required return, helps ensure a disciplined approach that increases the likelihood that a company’s Buyback ROI will be greater than what investors can passively do on their own. If the buyback price doesn’t meet the required thresholds, then excess cash can always be distributed through a special dividend, which is similar to a buyback but doesn’t involve price risk. The problem for many companies, though, is that executive compensation plans-more specifically, option strike prices-typically do not make adjustments for special dividends, and incentive contracts would need to be changed to insulate executive compensation from the effects of special dividends to make them more palatable.
In sum, it is important that the capital deployment strategy drive financial policy and not the other way around. When management becomes preoccupied with second-guessing the market’s reaction to financial policy, it often comes at the expense of long-term value creation. For example, in cases of companies encountering growth opportunities that might warrant cutting or just slowing the growth of dividends, managements’ fears of a negative market reaction have often proved groundless. Our experience has been that if the new dividend policy is accompanied by an effective, detailed, announcement of new organic or acquisitive growth investments, these negative share price reactions tend to be short-lived, with more sophisticated investors typically stepping in to pick up bargains created by the selling of others. And once having cut the dividend, and acquired a more reliable investor base, such companies can go about ensuring the long-term viability of the business by investing in growth.
Conclusion
Our study of healthcare companies suggests that, in most sectors of the industry, higher stock returns are associated higher R&D and more active acquisition strategies. And consistent with this strong positive association with corporate investment, healthcare stock returns also show a clearly negative relationship with stock buybacks, dividend growth, and levels of corporate debt. In fact, for companies with more cash and capital than promising investment opportunities, the value-maximizing use of excess corporate cash for the healthcare industry as a whole appears to be paying down corporate debt, not raising more to help buy back stock. And perhaps even more surprising, those healthcare companies that have chosen to raise capital through seasoned equity offerings have been among the industry’s strongest performers. These findings have a number of implications, and can be seen as providing healthcare managers and investors with a number of guideposts. In addition to confirming the value of healthcare investment in R&D and acquisitions, our findings can be helpful in setting financial policy and in developing and implementing measures for evaluating and rewarding corporate performance. Companies that employ these polices and measures are more likely to drive TSR through the value they create by effectively reinvesting in the business and not simply trying to manage to day-to-day investor feedback.
Perhaps most important, corporate strategies and business management processes should aim to find and maintain the value-maximizing balance between the pursuit of growth and ever higher returns on capital. To help managers in this task, we recommend using a cash flow-based measure of economic profit called Residual Cash Earnings (RCE), both for internal strategy development, decision making, and performance evaluation, and for communicating management’s strategies and results to the investment community.
- We find this approach to be sufficiently robust, more comparable, and easier to interpret than running OLS regressions. Our method is strictly a comparison of group medians (as though one were to build and compare periodically rebalanced and equallyweighted portfolios). Regressions, however, are typically more difficult to interpret because of a low R-squared, which often result because of the mood swings of the market. Instead of TSR values, percent ranks can alternatively be utilized to help normalize this variable in a regression, but results can still be difficult to interpret and compare.
- In the case of the large established pharma companies, our finding that high R&D Reinvestment Rates are associated with 6.6% lower TSR than their low R&D peers came as such a surprise that we studied it further. We introduced a three-year lag for R&D Reinvestment Rate to explore the possibility that today’s high reinvestment rates are a leading indicator of future TSR. More specifically, we studied the R&D Reinvestment Rate during each three-year period and then related it to TSR in the subsequent three-year period. Although this lag did show a positive relationship (+3.6%), it is fairly inconsistent through time. And increasing the rolling period length from three to five years did not improve the relationship.
- RCE is a cash flow based measure of economic profit that we first introduced in an article published in this journal in 2010. See Gregory V. Milano, “Postmodern Corporate Finance,” Journal of Applied Corporate Finance, Spring 2010.
- See “Stocks That Dodge The Buyback Blues,” May 1, 2017, Fortune Magazine; and the 2017 Fortuna Buyback ROI Report.
