
Let’s start with Investopedia, which defines the “conglomerate discount” as “the tendency of the stock market to undervalue the stocks of conglomerate businesses.” The conglomerate discount, as the entry goes on to say,
…is calculated by adding an estimation of the intrinsic value of each of the subsidiary companies in a conglomerate and subtracting the conglomerate’s market capitalization from that value. The conglomerate discount arises from the sum-of-parts valuation, and it is the reason why many conglomerates spin off or divest subsidiary holdings. Investors often point to the conglomerate discount as a market inefficiency and view the discount as a way to buy undervalued stocks.
But is the answer really this simple? If the discount reflects mainly the market’s inability to evaluate the underlying profitability of large companies with lots of different businesses, then the underpricing should disappear over time, as the profitability of those businesses becomes clear. In that case, moreover, even those of us with a modest commitment to the idea of market efficiency would expect to see the most sophisticated, “value-based” investors buying conglomerates at what turn out to be bargain prices. But if, on the other hand, the conglomerate form appears to be a predictor of reduced future operating returns, investors would be justified in assigning discounted values to collections of assets without a clear strategic rationale.
Further complicating this question, corporate strategies with respect to diversification have changed over time and appear to move in cycles, with companies pursuing diversification through acquisitions during some periods and seeking an increase in focus through divestitures and spinoffs during others. In the 1960s and 1970s, for example, companies viewed diversifying acquisitions as a means of achieving better capital allocation, more efficient capital structures, and smoother earnings. But this trend started to reverse in the 1980s, when a significant percentage of these diversified companies found that the burdens of the conglomerate form began to outweigh the benefits.
So what drives these strategic conglomeration and de-conglomeration decisions? What is most important in determining whether break-ups create value?
To answer these questions, it is critical for us to decide whether so many large, diversified companies have a value recognition problem or a value creation problem. To illustrate this distinction, for years GE was said to be so well run that it avoided the conglomerate discount; but given the company’s share price performance during the past decade, that reputation has been tarnished. Does the decline in GE’s valuation signal the emergence of a “conglomerate discount” or has the company experienced a performance problem? Are there steps that large, diversified companies like GE can take to ensure that their performance and valuation are comparable to those of focused companies?
In addition to the diversity of their operations, conglomerate businesses also tend to be larger than focused businesses. An alternative explanation of the conglomerate valuation discount could be that the problem is a function of the size rather than the diversity of the businesses operations. In economics class, students learn the virtues of economies of scale that enable companies to drive down their average cost of production through expansion. The ability to spread fixed cost across a larger base of business is supposed to result in better financial performance. Executives go to great lengths to rationalize their acquisition and growth strategies by citing the benefits of scale. The frequency of such claims by companies begs the question whether larger companies actually do benefit from scale. Do large companies perform better and create more value for shareholders?
We have recently completed two separate but related research studies that shed new light on the implications of the conglomerate discount and the impact of size on performance and value. In this article, we present, interpret, and integrate the findings of these two studies with the aim of identifying their implications for corporate strategy and helping company executives create more value for their investors.
A Fresh Perspective on Business Diversity2
There has been considerable research on how business diversity affects valuation, usually involving sum-of-the-parts comparisons of diversified and focused companies using public segment financial data and average trading multiples of comparable “pure play” peers.3 Most of this work finds that diversified businesses tend to trade at lower valuation multiples than a composite of their focused peers, suggesting a “conglomerate discount” for diversified companies.
But this sum-of-the-parts approach to measuring this valuation gap has several shortcomings. First, by relying on high-level, summarized segment data with uncertain corporate cost allocation and transfer pricing policies, there is the possibility that the earnings used in the valuation of each segment could be distorted. What’s more, the effect of these distortions could be enlarged by opportunistic companies that try to take advantage of how investors use sum-of-the-parts analysis by choosing allocation and transfer pricing policies that, while still within the discretion allowed by accounting practices, result in higher profits in segments with higher industry multiples. To the extent that this potential for distorting the allocation of profit is recognized or just suspected by investors, valuations could remain low and thus create the illusion of a conglomerate discount (since the sum-of-the-parts would imply a higher valuation than the market’s).
Second, the sum-of-the-parts approaches typically use average peer multiples with little if any recognition that differences in operating performance are likely to affect the multiple. The peers may warrant higher multiples if they are growing more rapidly, reinvesting more in the future of the business, or generating higher returns on capital than the segments of the diverse company.
Finally, many diversification analyses discuss the valuation disconnect by focusing on valuation multiples instead of the main concern of the firm’s shareholders—the Total Shareholder Returns (TSR, or dividends plus capital gains or losses) generated over time. Even companies with persistently low valuation multiples can create tremendous wealth for shareholders through capital gains and dividends.
To avoid these shortcomings, we examined valuations in relation to the economic returns delivered by diversified companies as a premium or discount to the valuations of focused companies.4 By so doing, we adjusted for differences in actual performance and avoided allocation and transfer pricing issues by focusing only on consolidated results. In this way, we attempted to determine whether the apparent discount in trading multiples seems attributable to an unwarranted investor bias against diverse businesses, or to the market’s recognition of the differences in efficiency and growth achieved by diverse businesses. The difference for an executive deciding on strategy is critical since it may not be necessary to separate unrelated businesses provided they behave more like their focused counterparts in terms of returns, reinvestment, and growth.
The sample for our study consisted of the largest 1,000 non-financial U.S. companies over each of the five-year periods ending in 2003 through 2009. (That is, we studied each of the seven five-year periods starting with 1999-2003 and concluding with 2005-2009.) We then examined each of these periods and integrated our findings over time across bull and bear markets. Companies were classified as either “focused” or “diversified” based on their latest available business segment SIC codes in the Capital IQ database. Companies with business segments in two or more 2-digit SIC Codes were considered diversified, and we found 544 of them.
The relative valuation premium or discount to the operating performance of diversified companies compared to that of their focused peers varies over time but the average difference was relatively small. This finding suggests that, on average and over time, the differences in valuation of diverse businesses relative to focused businesses are not primarily attributable to a disconnect between performance and the capital markets. Instead, we found that the differences in the level of valuation can be explained mostly by differences in operating performance as reflected in the economic returns and revenue growth. In sum, the problem seems to be one of value creation, not value recognition.
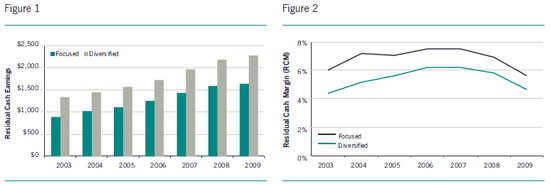
As shown in Figure 1, our research indicates that, on average, diversified companies produced higher Residual Cash Earnings (RCE),5 which is equal to after-tax cash flow in excess of a charge for total capital that reflects the required return of investors on gross operating assets (expressed as a dollar charge for capital). For the five-year periods ending in years from 2003 through 2009, RCE was on average 40% higher for diversified companies than for focused companies. This finding shows that many large, diversified companies have succeeded in adding value for their shareholders through incremental investments that, on average, have produced cash returns in excess of the required return on the incremental capital.
But, to understand why the market continues to applaud the break-up of many apparently well-run companies, we must take a deeper look at the underlying drivers of valuation. In an article published in this journal in 1996, Stephen O’Byrne broke down the valuations of all companies into two components: current operations value (or COV) and future growth value (FGV).6 He defined COV as the present value of the company’s current earnings stream assuming it remains constant forever, and FGV as the present value of expected improvements.
For our purposes, we can adapt this COV-FGV framework to our RCE model by considering COV to be the assets invested in the business plus the present value of current RCE assuming it remains constant forever, while FGV is the present value of expected improvements (or declines) in RCE. In this context, it is clear that large, diversified companies have enhanced their COV by delivering more dollars of RCE. So if these companies don’t suffer a COV problem, the apparent differences in valuation must stem from differences in FGV that are attributable to differences in expected improvements in RCE going forward.
We decided to test two of the main drivers of future RCE growth. The first was Residual Cash Margin (RCM), which portrays RCE as a percentage of revenue. The suggestion is that companies with higher RCM will be likely to deliver more future RCE growth per dollar of revenue growth. The second driver we tested was revenue growth itself.
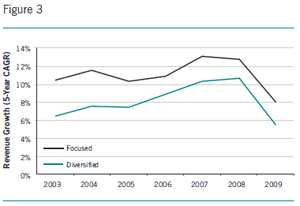
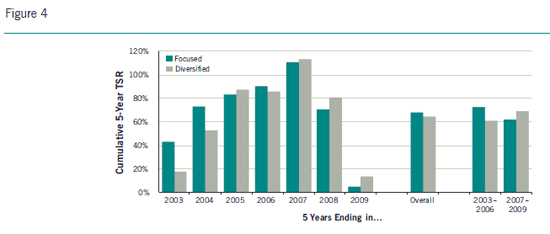
As shown in Figure 2, RCM averaged 1.4% lower for diversified companies. In other words, for each hundred dollars of sales, diversified companies incurred an extra $1.40 of cost and capital charges. But it’s not only in margins where diversified businesses lag their focused peers. Our analysis also shows that the average top-line revenue growth of diversified companies is lower. As shown in Figure 3, focused companies delivered more revenue growth per year in every period studied, with an average difference of nearly three percentage points (that is, 10% vs. 7%).
In sum, what looks like a conglomerate discount when researchers compare multiples appears to reflect smaller expected performance improvements by diversified business that are attributable to their lower growth rates and delivering fewer dollars of RCE for each dollar of that growth.
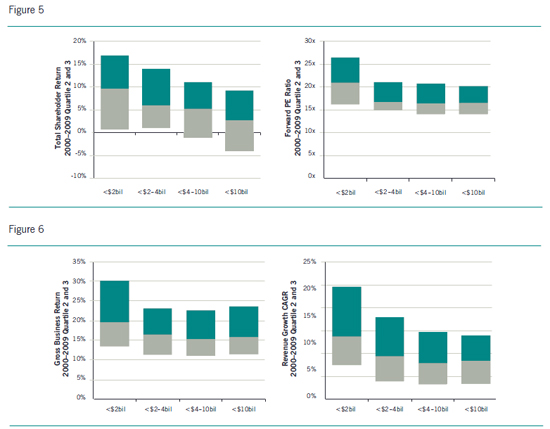
Moreover, as shown in Figure 4, this underperformance reduced their long-term returns to shareholders. During the entire period 1999-2009, focused companies delivered five-year cumulative total shareholder returns (or TSRs) that were 3.6% higher than those of diversified companies. Furthermore, during strong up markets—the five-year periods ending in ’03, ’04, ’05 and ’06—the focused companies substantially outperformed the diversified companies, with 11.7% higher cumulative TSR. On the other hand, the diversified companies delivered 7.2% higher TSRs during the financial crisis—the five-year periods ending in ’07, ’08 and ’09—which may be a sign of a flight to safety in tough times. As might be expected, the less correlated cash flow streams of the diversified businesses and the potential to fund projects internally when the capital markets failed appear to have been rewarded by investors during periods of turmoil in both product and financial markets.
But is this the entire story? Are the factors that influence the lower operating performance a function of the diversity of the business? Or, is the larger size of the more diversified businesses the main force affecting both operating and share price performance?
New View of Business Size7
To test the effect of size on performance and value creation, we conducted a separate study that examined the 1,000 largest nonfinancial U.S. companies, excluding any that were not public for the full decade of the 2000s. We then divided the remaining sample of 748 companies into four categories based on the amount of their earnings before interest, taxes, depreciation and amortization (EBITDA) for the full decade, and then evaluated various measures of share price performance, valuation, and operating performance. As a result, our size classifications reflect profitability as well as size. (As discussed in more detail later, our decision to create categories based on cumulative EBITDA reflects the observation of many executives that the sheer amount of available cash flow has made reinvestment and growth more difficult.)
As can be seen in Figure 5, which shows the two quartiles of performers just above and below the median, the smallest companies delivered median annualized total shareholder returns (TSR) of 9.7%, which was over three times the performance of 2.7% for the largest group. At the same time, the figure also shows that there was considerably more variation in the TSRs of the smaller companies, introducing a level of risk that only partly offsets the benefit of the higher median return.
These results also held when we looked at the valuation multiples of the smaller and larger companies. We examined the average forward price earnings (PE) ratio based on the share price at the end of each of the ten years divided by the consensus research analysts estimates for EPS over the next twelve months. The median of the smallest companies had an average forward PE ratio of 20.9x versus 16.6x for the largest group. But, again, there was considerably more variation in the PE multiples of the smaller companies.
Moreover—and perhaps most important finding in addressing the main question of this article—our analysis indicates that these substantial share price performance gaps can be explained to a large degree by differences in growth and operating returns on capital. As shown in Figure 6, larger companies generated lower gross business returns —15.8% versus 19.5% for the smallest group—despite their “scale” advantage. Even with their ability to spread fixed cost across a larger base of business, such companies are clearly less profitable when evaluated on the basis of return on capital.
In addition to capital efficiency, growth seems to be a struggle as well. The median company in the largest group delivered 7.0% revenue growth per year, as compared to the 11.3% delivered by the median company in the smallest group. (Note that these growth rates are actual observed growth rates that thus include both organic growth and growth achieved through acquisitions.)
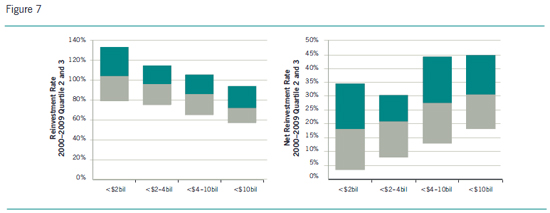
Part of this sales growth gap could be attributable to lower reinvestment. The data suggests that large companies reinvest a substantially lower proportion of their cash flow back into the business in the form of capital expenditures, R&D, and acquisitions. As shown in Figure 7, whereas the smallest companies reinvest a median of 104% of their cash flow into the business, the largest group reinvests only 72%. These findings provide support for the common claims of large company executives about the difficulty of finding profitable investment opportunities for their significantly larger amounts of cash flow.
But if they don’t invest in the business, what do large companies do with their cash flow? They distribute substantially more of it through dividends and share repurchases—30.5% of their cash flow versus 18.3% for the smaller companies. While these distributions are often labeled as “shareholder friendly,” our published research on this topic shows that, on average and over time, companies that reinvest larger percentages of their cash flows tend to produce higher TSR.8
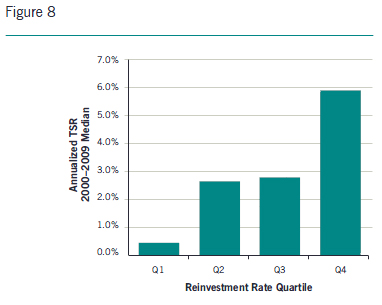
For those companies that have the investment opportunities to justify such reinvestment, then, the benefits of high reinvestment are clear. Even though the largest companies tend to reinvest at a lower rate, those that are able to find promising growth opportunities appear to add value through such reinvestment. As shown in Figure 8, for example, when we divided our largest company sample into four subgroups based on how much of their cash flow they reinvested, we found that the highest reinvestment group delivered median annualized TSR of 5.9% versus 0.4% for the lowest reinvestment group. Although still below the TSR generated from the smaller companies, it greatly closes the gap for shareholders.
In sum, larger companies as a group tend to have less growth potential—certainly compared to the current size of the firm—than smaller companies. And most large profitable companies are likely to find it challenging to reinvest large amounts of their cash flow without reducing their returns on capital. But to the extent that they find projects that promise to earn at least their cost of capital, they should take them, with the expectation that they will be increasing their own values.
Why Do Larger and More Diversified Companies Underperform?
The specific reasons vary greatly, but there are a number of common themes:
Organizational distance: The top executives of large and diversified companies are often far removed from the leaders running the businesses. This organizational distance prevents the use of full and objective information in strategic decision-making at the top and tends to slow down the decision processes at the bottom.
Capital Allocation: Business units have different internal needs and external dynamics, yet their investment opportunities are often either over- or underfunded because of peaks and valleys in the demands and priorities of other businesses. In some cases, there is a general “smearing” of capital across the company. But such a policy means that businesses will achieve their optimal reinvestment rate more by accident than design, leading to value gaps attributable to both underinvestment in promising growth opportunities and overinvestment in mature businesses.
Human Capital Allocation: Often some of the best executives are placed in “problem” businesses to turn them around. Although these turnarounds create value, the potential value creation of the more successful businesses and the overall company can suffer as a result. In other instances, the lack of human capital limits the growth options the company can pursue as it fails to develop and retain strong managerial talent.
Cross Subsidies: Internal cross-subsidies usually stem from ineffective cost allocations and transfer pricing schemes that sometimes have the effect of propping up poor performers, hiding the severity of a negative situation even from top management. Such cross-subsidies, although often unintentional, can be used deliberately by executives to encourage their business unit heads to make adequate investments in new areas. But the shareholders of the companies that fund such investments will be happier if provided more information about the true economics of these investments.
Governance: The behavior of public company executives is influenced by the carrot and stick of rewards and accountability, but inside many diversified businesses there is inadequate carrot and very little stick. The star performers in such companies are rarely adequately compensated for their successes, and poor performing unit managers hardly ever face adequate accountability and pressure to turn these value destroyers around. The executives of focused businesses almost always have more “skin in the game” than the diversified business subsidiaries they compete with, and this is one of the reasons they perform so well.
What Should Executives of Large Diversified Companies Do?
Don’t Wait for Activist Investors to Demand a Break-Up
In recent months, the list of large diversified companies that have decided they would be worth more as several smaller, focused companies has been growing sharply. Many diverse companies are breaking up after years of defending their business models. Unfortunately for management, these actions have been initiated mainly by outside activist shareholders. It would have been better for management, and possibly for shareholders too, if management had first considered the break-up alternatives without the need for intervention by outsiders. Large diversified companies should periodically evaluate their internal strategies, performance, and synergies to see whether their different businesses are worth more as parts of a single organization than as smaller, stand-alone businesses.
Learn a Lesson from Private Equity Success in Diversified Businesses
At present, the Capital IQ database lists 117 direct investments by Kohlberg Kravis and Roberts across a wide range of industries and geographies. Viewed as the sum of their investments, KKR is much larger and more diversified than just about all of the companies in our research sample. Yet over the last few decades they have created substantial value for their investors, which would appear at odds with much of the research presented herein.
How do private equity firms such as KKR generate such strong internal performance and so much value as owners of so many different businesses? These investment firms understand that each business needs to maximize its own value by developing and executing a strategic plan that is monitored and funded separately, in contrast with the capital allocation process across their portfolio of companies. This separation of businesses also ensures transparency and avoids any threat of cross-subsidies, hidden or otherwise.
Governance comes from leverage and strong ownership incentives that furnish the carrot and stick necessary to deliver results. Private equity firms motivate the executives in their portfolio companies differently. In the words of Marc Hodak, an adviser to private equity portfolio companies,
Private companies can do things with compensation that their public counterparts can simply no longer do. They can focus on specialized measures [that are] consistent with the investment thesis of their particular investors rather than the one-size-fits-all GAAP favored by institutions way too busy to figure out the virtues of non-GAAP measures. They can set targets consistent with the multiple-year time horizon of their investors, and change those targets as conditions change, without having to confront governance critics who assume that every such change is a conspiracy by boards to overpay their executives. Private companies can take fuller advantage of the tax code in deciding how to deliver compensation without having to adhere to arbitrary standards used by proxy advisors with regards to, for example, fixed versus variable pay, or stock versus cash comp. Private companies can pay whatever they need to attract the talent they want, and increasingly do so at the expense of public companies that are increasingly shy about paying top dollar for specialized talent.
But one ironic result of all the scrutiny that has been drawn to public company pay practices is that public companies now have to pay more for their top people. My private clients are finding that more and more top executives prefer to work for private companies, and are increasingly willing to work there for less, especially in terms of cash compensation, but also in terms of regular grants of equity.9
Managing a Diversified Business: Building a Culture of Internal Capitalism
In 2009, our firm, Fortuna Advisors LLC, introduced the term “Internal Capitalism” to describe a corporate culture and set of practices that emphasize the importance of strategic decision-making that is linked through continuous performance assessment to the corporate goals of boosting efficiency and sustainable growth. Perhaps nowhere is the need for Internal Capitalism greater than within a diversified business. Judging from the findings of our research, this culture appears to be lacking in many of today’s diversified organizations.
As we see it, Internal Capitalism requires a commitment by top management and the implementation of a straightforward four-step process:
Step One: Better Understand Investor Expectations: Evaluate the company, business strategies, and performance from the view of a sophisticated buy-side investor and develop an analysis of the public view of your company. Consider views from equity research and rating agency reports to identify perceived opportunities and risks. Collect similar insights on peer companies to serve as benchmarks. Understand what investors are saying about the prospects for the different businesses based on the expected growth and profitability that are reflected in the share price. And then compare these insights and expectations to management’s strategic plan to understand the gaps in strategy, performance, or investor communications. Quantify the level of performance needed to deliver top quartile total shareholder return and use this as a guide for stretch goal setting.
Step Two: Evaluate and Refine the Business Portfolio: Which businesses have productive growth options going forward? Have adequate resources been supplied to businesses that create value and withdrawn from those that do not? Evaluate the past, present, and future expected growth and efficiency of each business unit. And make sure you consider these analyses “over the cycle” to avoid being overly pessimistic in economic troughs and too optimistic in boom times.
Consider portfolio options such as growing strong business units both organically and acquisitively, and separating poor performers through divestitures and spinoffs. Lean toward putting assets to work when times are tough (and assets are less expensive) and separating assets when times are good to practice “Buy Low, Sell High.” But don’t be afraid to separate businesses at any point in the cycle if they are attracting too much management attention away from the pursuit of growth investments.
Step Three: Align Strategies with Shareholder Interests: Value is created when resources are “put to work” earning adequate returns and when assets are sold for more than they are worth internally. The common practice of planning by extrapolating the past with a hockey stick upside is no longer adequate, if it ever was. To be successful, planning processes must help managers formulate strategies for driving innovation, growth, differentiation, and efficiency.
Begin with an evaluation of the competitive landscape and the customer’s value proposition. Look for underserved gaps and identify a group of potential new strategic initiatives that broaden/deepen market penetration, improve profitability, or otherwise materially boost financial performance. Then prioritize and select initiatives based on growth, differentiation, and efficiency. The strategic plan establishes a “business case” for each initiative and a roadmap for achievement. If your business is large and diverse, err culturally on the side of “more investment” to overcome any bias toward low investment and low growth.
Step Four: Embed Discipline in Management Processes: To reinforce the strategy, processes for budgeting, decision-making, measurement, and compensation must be aligned with the shareholder value focus. The very same measures used to develop the strategy need to be the focus of the budgets and scorecards to ensure accountability for execution. Make sure these business management processes adequately support the simultaneous pursuit of high returns on capital and substantial future growth investment.
To motivate owner-like behavior requires incentives based on comprehensive measures of growth and efficiency at the appropriate level of the organization. If suitable, incentives can be multi-year, with money at risk and with serious upside opportunities to simulate ownership inside the organization, but care must be taken to avoid promoting a gambling mentality.
Some of the research from the 1970s that emphasized the benefits of diversification (and, in effect, size) made the case for the superior efficiency of “the internal capital markets.”10 Since then, however, the external capital markets have grown by leaps and bounds in both efficiency and creativity in directing capital. But many organizations have not improved their processes for capital allocation and incentives to take advantage of their internal markets and, in fact, would be better off as separate entities. What should be a benefit too often has become a liability.
In many cases, the best path for diversified companies may be to break up. But in cases where this is not the strategy, the principles and practices associated with our concept of Internal Capitalism can help a diverse company to act more like private equity investors in terms of capital allocation, cross subsidies, and governance. Executives must challenge their business unit managers to stand on their own two feet and reinforce this challenge with owner-like rewards and accountability.
- More precisely, the calculation was return on total gross capital, which is defined based on the concept of Gross Business Return (GBR) which is after tax EBITDAR divided by gross inflated operating assets including capitalized R&D and leases. For more information on the calculations and benefits of this measure of return, see Gregory Milano, “Postmodern Corporate Finance” in the Spring 2010 issue of the Journal of Applied Corporate Finance.
- The high level findings of this research study were first published by Milano, Treadwell and Hopson in “Is Corporate Divorce the Answer,” Buona Fortuna, February 14, 2011.
- See Berger & Ofek (1995), and Graham, Lemmon & Wolf (revised 2001).
- For this analysis, we performed a regression on each company’s Gross Business Return (cash generated as a percent of gross assets) against the enterprise value relative to this asset base. The approach has shown over time to provide a high degree of correlation (typically between 60-70%). We used the relative premium or discount to this regression line and compared this premium or discount between diversified companies and focused companies.
- For more information on Residual Cash Earnings calculations and improvements over prior measures of economic profit, see “Postmodern Corporate Finance” in the Spring 2010 issue of the Journal of Applied Corporate Finance.
- Stephen F. O’Byrne, “EVA® and Market Value,” Journal of Applied Corporate
Finance, Spring 1996. - The high-level findings of this research study were first published by Milano in “Too Big to Succeed,” CFO.com, April 29, 2011.
- See “Are You Reinvesting Enough?,” CFO.com, March 4, 2011.
- Marc Hodak, in conversation with one of the authors.
- Weston (1970)
