With this ever-changing industry landscape has come new business paradigms—some likely to stay but many others not. Along with the new technologies and ways of doing business have also come new business strategies and new ways of making business decisions that will play important roles in determining whether companies thrive, fail, or just survive in these new market conditions. Now more than ever, it is critical for both investors and executives to understand how the market really values technology companies. What factors most strongly influence share prices? And what factors do not seem to make much of a difference?
To manage a tech company in a way that meets investors’ near-term as well as longer-term expectations, the factors that most strongly affect share price appreciation must be clearly identified and consistently emphasized, both in internal decision-making and in communication with the investment community. For example, is growth in revenue and earnings the main focus of shareholders of tech companies, or are there other aspects of corporate performance that contribute more to corporate market values and shareholder returns?
In this article, we take two different paths in addressing these important questions. We begin by summarizing the findings of our recent study of the operating and stockmarket performance of 169 publicly traded tech companies with market caps of at least $1 billion that have been listed since 2004. The aim of the study was to find out which of the many indicators of corporate operating performance—including growth in revenues and earnings, growth in EBITDA and EBITDA margins, and return on equity—have had the strongest correlation with shareholder returns over relatively long periods of time. What we found is evidence that investors are looking for signs of neither growth nor profitability alone, but an optimal mix or balancing of those two goals. And that mix, as we argue in the pages that follow, is captured in a measure that we call “residual cash earnings,” or RCE. Moreover, for students of finance and accounting, this finding makes perfect sense since RCE is a cash-flowbased variant of “residual income,” which is viewed by many finance scholars as the single-period, or “flow,” measure of corporate operating performance that ties most directly to “stock” measures of corporate value, such as net present value (NPV) and discounted cash flow (DCF), that are supposed to be reflected in stock prices.
In the second part of this article, we illustrate the findings and importance of our study using the case of one of the largest (in terms of market cap) and best-performing tech companies in the world: Amazon.com. We begin by asking: why has Amazon been valued at such high multiples and experienced such remarkable share price performance when, by most traditional metrics, especially reported net income and earnings per share, its operating results appear lackluster at best? We attempt to explain this apparent disconnect between Amazon’s value and operating performance by drawing on the findings of our broad-based study. What we find is that despite its lack of accounting net income, Amazon performs quite well in terms of RCE. By treating R&D spending as an investment of capital rather than an expense, RCE provides a view of a company that is distinguished by both the amount and the productivity of its investment—both of which have been obscured by the use of Generally Accepted Accounting Principles (GAAP). And thus, in the process of explaining Amazon’s success in creating value, we show how and why certain traditional metrics—again, notably, GAAP earnings and other measures derived from it—fail to capture the economic realities of many tech companies.
Along with our study of corporate performance measures, we also analyzed the effects of corporate capital deployment—notably, rates of reinvestment and stock repurchases—on tech company stock returns, and again in the specific case of Amazon. As in our analysis of performance measures, our findings on corporate reinvestment reinforce the message that today’s most successful technology companies are being managed under a different lens—and in accordance with a different set of performance criteria—thereby avoiding the most distorting effects of operating in the world according to GAAP.
The Findings of Our Study
Our study of 169 large tech companies was designed to help us answer the following question: which of the many indicators of corporate operating performance that are tracked by companies and equity analysts have had the strongest correlation with shareholder returns over relatively long periods of time? With this goal in mind, we collected data for the 169 companies on eight different performance metrics for the 12-year period starting in 2004 and running through the end of 2015. The metrics included the following five widely measured and monitored performance indicators: (1) sales growth; (2) gross business margin; (3) operating margin; (4) EBITDA margin; and (5) return on equity (ROE). And to this list we added three of our own: (6) gross business return; (7) (change in) residual cash earnings; and (8) residual cash margin.
Our next step was to divide our 12 years of operating data and performance into ten rolling three-year periods with endpoints in each year from 2006 to 2015, with the first period running from 2004-2006, the next from 2005-2007, and so on. Then, for each of the eight operating measures, we assigned each of the companies to one of three tiers—high (performance), medium, and low. For example, the companies with the highest cumulative average growth rates in three-year sales were put in tier 1 and the companies with the lowest in tier 3.
To try to quantify the importance of each metric in explaining value creation, we also calculated each company’s total shareholder return (TSR) over each rolling three-year period. (TSR is calculated as capital appreciation plus dividends as a percentage of the beginning share price.) And for each of the performance metrics, we compared the median TSR of the high-performance (tier 1) companies with the TSR of the tier 3 companies. For those performance measures for which the median tier 1 TSR was not much different from the median tier 3 TSR, we concluded that the metric was not helpful in explaining differences in TSR, and so probably not an important driver of value. But in those cases where the median tier 1 TSR was much higher than the median tier 3 TSR, the metrics were viewed as potentially important contributors to TSR and the value creation process.
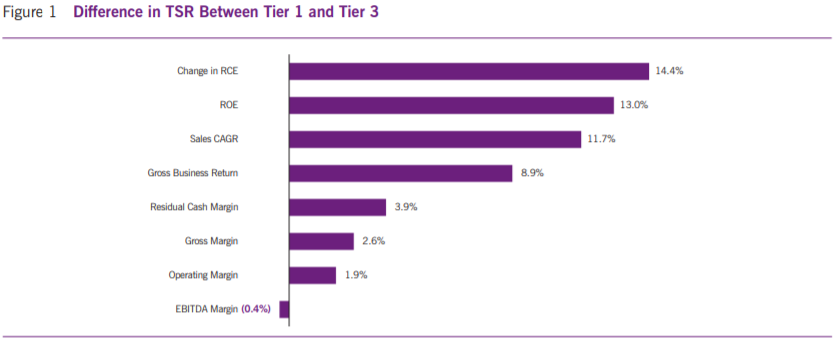
Figure 1 summarizes our findings by showing, for each of the operating performance metrics we analyzed, the difference between the median TSR of the tier 1 and tier 3 companies. As can be seen in the figure, the change in RCE, as a percentage of beginning assets, showed the biggest difference in median TSR when moving from the worst RCE performers (tier 3) to the best RCE performers (tier 1). For all the ten rolling three-year periods in our sample, the top RCE companies had median annual TSR that was over 14% higher than the median TSR of the bottom RCE companies.
But not far behind RCE were two other measures, return on equity and sales growth. With all the focus on growth in tech, it is no surprise that sales growth is a major differentiating factor in the stock market performance of tech companies; those that grow faster tend to have higher TSR—but with one important qualification that we get to shortly. One particularly interesting finding was that all of the measures involving margins had the lowest relationships with TSR—particularly the popular proxy for cash flow, EBITDA, which is short for earnings before interest, tax, depreciation and amortization. The low explanatory power of margins seems especially important, given the amount of weight many investors put on improving margins and the widespread corporate practice of tying senior management’s incentives to increases in margins and other metrics based only on the income statement.
The common weakness of margins is their failure to take into account the amount of capital required to produce reported profits, net income, or cash flow. Said another way, a company can have very impressive gross margins, but still have low returns due to high capital intensity. Companies that operate with relatively little capital, such as service firms like Accenture plc, can create large amounts of value with below-average margins. But for companies like semiconductor manufacturer NVIDIA Corporation, whose business model is more capital-intensive, much higher margins are required to create value.
The bottom line, then, is that margins when considered alone are highly unreliable indicators of corporate value creation; and companies and investors that emphasize margins may want to view them with more caution, or at least in the larger context of overall value creation. And as our findings suggest, rate of return measures are likely to be much better performance measures because they incorporate both margins and capital intensity. That’s why we were not surprised to find that ROE had the second highest correlation to TSR.
But as useful as return measures like ROE are in predicting stock returns, managements that focus primarily on return measures will often make value-reducing decisions. Managers in high-return businesses who are rewarded for increasing those returns effectively face incentives to underinvest—that is, to turn down positive-NPV investments whose promised returns, although higher than the company’s cost of capital, are lower than the firm’s average return. Conversely, managers in weak businesses often overinvest because it is easy to find (negative-NPV) investments that will increase their low overall return. Hence, it is essential to balance growth and returns to limit these value-reducing decisions.
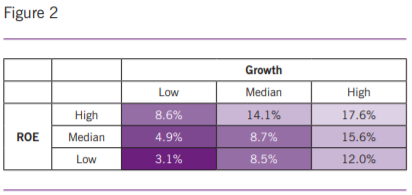
To examine the effect of growth vs. return on corporate stock price performance and market values, we built the three-by-three matrix shown in Figure 2 that places all companies in the high, medium, and low categories for both revenue growth and ROE. As we expected, companies with both high growth and high ROE had the highest median TSRs. In addition, growth appears to be a little more important than ROE in the tech sector. The companies with high growth and low ROE had median TSR of 12.0%, as compared to the 8.6% median TSR of companies with high ROE and low growth.
But the main message from the matrix is that a simultaneous focus on growth and ROE should work to limit the potential underinvestment (or overinvestment) problems that stem from focusing on just returns. Nevertheless, even while aiming to achieve both growth and efficiency in using capital, corporate managers are often faced with making difficult and important tradeoffs between them. For example, if you could invest more and give up one percent of ROE to fuel two percent more growth, would that add value? To answer this question requires sophisticated math. A single measure that integrates growth and return would make this much easier for operating (as well as finance) managers.
And that brings us to the financial performance measure called residual cash earnings, or RCE, which, as we reported earlier, appeared to do the best job of distinguishing valueadding tech companies from those with lower shareholder returns.
Residual Cash Earnings (RCE) Balances Growth and Return
RCE incorporates each of the three major drivers of shareholder value: growth, returns, and the investors’ required return on the investment of capital. This measure is calculated by taking the cash generated by the core business operations minus a “capital charge” that reflects the expected return of the shareholders (and lenders) for use of the company’s capital. In what follows, we break down the calculation of Amazon’s RCE in 2015.
The calculation of RCE begins with the income statement and a measure we call gross cash earnings, or GCE, which is the cash generated by the core operations of the business. As shown in Table 1, the calculation of GCE is essentially the same as that of after-tax EBITDAR—earnings before interest, taxes, depreciation, amortization, and rent—and, as is the case with the corporate use of EBIT measures generally, it is often customized for companies based on what is most appropriate in each given circumstance. For example, in the tech industry and other industries where research and development (R&D) is a significant form of investment, we treat R&D the same way we would treat capital expenditures—namely, as an investment, not an operating expense.
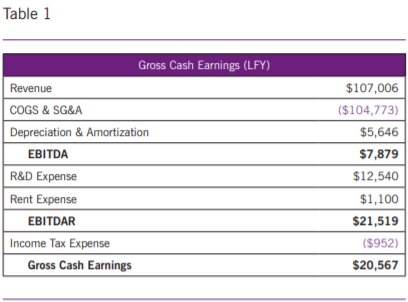
According to our estimates shown in Table 1, Amazon’s GCE in 2015 exceeded $20 billion. If you were to examine Amazon’s financial statements and compare them to our GCE calculation, you would wonder why Amazon’s net income in 2015 of only $600 million is so much lower than our calculation of over $20 billion of GCE. The biggest disconnect between Amazon’s net income and its GCE, as suggested above, stems from the treatment of R&D under U.S. GAAP. Because of all the uncertainty about the future benefits of any given R&D project, accounting rules require R&D to be expensed instead of capitalized, the way corporate investments in Property, Plant & Equipment (PP&E) are handled. But given the large past and expected payoffs from Amazon’s R&D, for corporate managers and investors intent on assessing the company’s long-run profitability and value, it makes far more sense to capitalize Amazon’s $12.5 billion R&D investment than to expense it. This adjustment of GAAP aligns much better with the characteristics of not only Amazon, but the tech industry in general, and accordingly does a better job of explaining differences in TSR.
Besides capitalizing rather than expensing R&D, GCE adds back depreciation and amortization as well as rent expense. Finally, GCE is normalized for non-recurring items such as restructuring charges, M&A charges, and asset writedowns. These adjustments are necessary to get a performance measure that better reflects the ongoing profitability of the business.
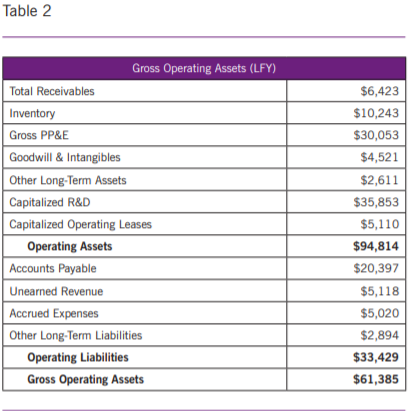
Now let’s look at the way that RCE handles the balance sheet and, most important, captures the amount of the company’s capital investment and investors’ required return on the capital that funds this investment. The capital of the company is defined as Gross Operating Assets (GOA), which includes gross PP&E, operating net working capital and other assets, including capitalized R&D and capitalized operating leases. And because investors expect a return on the capital they provide, RCE calculates and assesses a “capital
charge” for all forms of corporate investment. This assessment of a capital charge, besides explaining why RCE tracks value creation so well, has the benefit of holding management accountable for actually earning adequate returns.
As can be seen in the calculation of Amazon’s 2015 GOA (see Table 2), the primary differences between our calculation of GOA and the assets used in traditional return measures are in the treatment of PP&E, R&D, and operating leases. First, RCE uses Gross PP&E as opposed to Net PP&E. The majority of traditional return measures, such as ROE, ROA, and ROIC, treat depreciation as a period cost and, as a result, the earnings are measured against an asset base net of accumulated depreciation. When an asset is brand new, it incurs a depreciation charge; and because the asset is then at full value, the asset seems the most expensive the day it is purchased. As the assets depreciate, the return measures often automatically improve, giving a false or misleading signal of value creation. By making old assets seem artificially cheap compared to new assets, managers are encouraged to milk old assets and underinvest in new assets. By contrast, the elimination of depreciation charges from GCE and the use of Gross PP&E in GOA promotes growth investments because managers are accountable for a constant “capital charge” over the life of the asset instead of a charge that tends to be too high in the early years and too low later on as the asset ages.
At this point, some may object: isn’t using a high, undepreciated asset base setting an unfairly high hurdle rate, thereby discouraging promising investments? Our response to that is that, for purposes of performance measurement and evaluation, managers should focus on, and be held accountable for, the change in RCE, not the level of RCE. We are measuring results on a relative rather than an absolute basis. In other words, what’s most important is not where you start, but how much you improve from where you started. In our framework, improving from -$50 million to -$30 million of RCE should add roughly the same amount to the value of the firm as increasing RCE from $20 million to $40 million. Therefore, at least in terms of performance evaluation, the starting point becomes irrelevant and the fact that old assets start at what seems like a high gross value doesn’t affect the use of RCE as a performance management tool.
The second difference in our asset calculation is that we treat operating leases as an asset, which is consistent with the proposed new accounting rules. More specifically, we take the present value (PV) of the lease commitments and add them to the GOA.
Third and last, our formulation of GOA effectively makes management accountable for their R&D investments because the capitalized R&D incurs a “capital charge.” In Amazon’s case, as for most companies, we assumed a five-year life on their R&D investments. But this horizon for R&D investments can be adjusted in cases where there are clear and meaningful differences in the average useful life of R&D. And as in the case of PP&E, we consider capitalized R&D on a “gross” basis so there is no amortization; we simply sum the last five years of R&D, and put it in the GOA with the other assets.
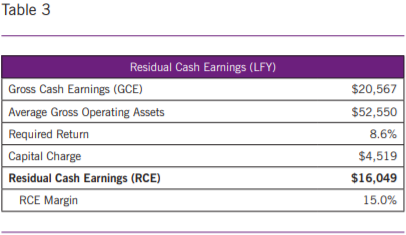
With our estimates of Amazon’s GCE and its GOA, we are now ready to calculate its RCE. As shown in Table 3, we start with its GCE of $20.57 billion and then subtract a “capital charge.” But to assess the capital charge, we first have to estimate the company’s required return. The required return is the expected return needed to persuade investors to commit their capital. It is similar to a company’s weighted-average cost of capital (WACC). But rather than using a conventional approach that involves the use of, say, the CAPM in combination with a long-term average equity risk premium, we instead seek to tie the required return more directly to the current level of stock prices and market valuations.
With this aim, we defined Required Return as the Gross Business Return (GBR) that would make a firm’s current enterprise value (the current market value of its debt plus equity) equal to its GOA, where GBR is simply its GCE divided by its average GOA. But rather than do this calculation for Amazon itself, we determine the required return for the broad market at any given point in time as the median of the required returns for the 1,000 largest non-financial public companies. For 2016, we came up with a required return of 8.6% for the market.
Then we estimated the company’s charge for use of investor capital by multiplying its average GOA of $52.5 billion by the required return of 8.6%, giving us a capital charge of $4.5 billion. And subtracting that capital charge from Amazon’s GCE of $20.6 billion leaves the company with an RCE of just over $16 billion.
The important message here, then, is that by making a small number of fairly straightforward adjustments to GAAP earnings—that is, by ignoring non-cash depreciation, treating R&D as an investment, and capitalizing leases—we can see that Amazon is a remarkably profitable company, despite the apparent lack of profitability implied by standard accounting net income. When measured correctly, the company’s operating returns greatly exceed any reasonable estimate of its required return on capital, having achieved over $16 billion of RCE last year.
What’s more, Amazon’s profit margin, again when measured the right way, is impressive as well. As reported at the bottom of Table 3, Amazon’s RCE margin, which is simply RCE divided by revenue, was 15%. This estimate, moreover, when viewed in the context of our study of tech companies, was in-line with that of the typical tech company in 2015—as well as being almost 2.5 times the 6.3% median for the rest of the 1,000 largest non-financial companies listed in the United States. This difference in RCE margins goes a long way in explaining why the valuation and TSR of tech companies are so positively affected by growth; it effectively says that each dollar of growth typically adds 2.5 times as much value as the same rate of growth experienced by a typical non-tech company.
Thus, where conventional GAAP-based analysis has led some commentators to argue that today’s tech companies actually need more growth to make up for what appears to be low levels of reported profits, our analysis based on the use of RCE shows that tech companies’ current level of and emphasis on growth are adding value precisely because the companies are in fact much more profitable than their non-tech counterparts. In the next section we look further at how RCE reflects profitability, and will be delving deeper into a discussion of reinvestments later in the article.
More on RCE and Stock Price Performance
That brings us back to our main finding about today’s large tech companies: namely, that the change in RCE appears to do the best job of explaining the exceptional performance of today’s most successful tech companies. As discussed earlier, when we evaluated the relationship between RCE improvements and TSR for 169 tech companies by measuring the change in RCE over three years as a percentage of the starting
GOA, the high performers on this metric far outperformed the worst performers—and by more than any other metric in our study.
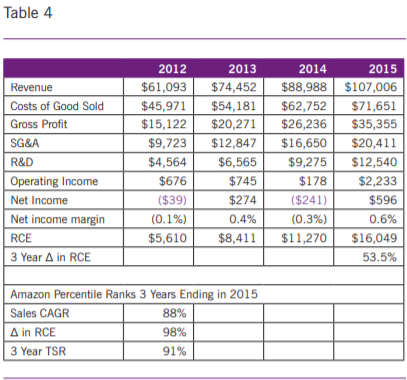
But now let’s take a closer look at the relationship between Amazon’s accounting measures, its RCE data, and its stock price performance (as measured by its TSR) during the most recent three-year period (2013-2015). As shown clearly in Table 4, both Amazon’s sales growth and its increase in RCE provided a remarkable contrast with its net income (in some quarters they reported a loss!) during this period. Indeed, the contrast was so remarkable that, as reported at the bottom of the table, the company was ranked at the 88th percentile among our sample of 169 tech companies for sales growth, and at the 98th percentile for percentage increase in RCE. And consistent with the findings of our study reported earlier, Amazon’s TSR came in at the 91st percentile.
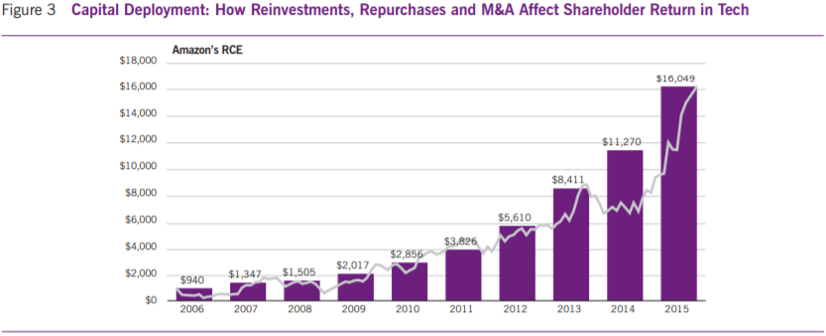
In sum, Amazon’s strong track record of continuous RCE improvement has essentially been mirrored by the increase in its stock price and market capitalization, as can be seen in Figure 3. At times the stock gets a little ahead or behind, perhaps as investors change their degree of optimism or pessimism about the future, but over time it seems to keep getting back on track with the RCE.
Capital Deployment: How Reinvestments, Repurchases and M&A Affect Shareholder Return in Tech
Quality vs. Quantity of Reinvestments: Which Matters More?
In recent years, the common sentiment among investors and analysts alike has been that valuation in the tech sector is all about growth. And although we present evidence in support of the value of growth above, this view has had the unfortunate effect of leading some management teams to invest as much as possible, and so try to achieve growth at any cost. Even when no good investments were available, some managements seem to have invested anyway, with the result that growth did not increase and profits went down. The “story” about investing in the future may sell well for a while, but when investments fail to deliver growth, investors eventually figure out the truth. And with the aim of reinforcing this point, along with our fundamental research we discussed earlier, we also examined how companies deploy their capital to discover what really drives TSR in the tech sector and to observe whether the common sentiment about the market’s view of growth is consistent with the underlying reality.
What we discovered was that how much a company invests, known as the “reinvestment rate,” has no systematic or predictable impact on TSR. A company’s reinvestment rate is defined as its total investment—whether in the form of CapEx, R&D, cash acquisitions, or increases in net working capital—divided by GCE. As such, it tells us only how much of the cash that a company generates is being reinvested back into the future of the company, but nothing about the payoff or return from that investment. And so we were not surprised to find that whereas the highest reinvesting companies had a median TSR of 12.8%, the lowest reinvesting companies had a median TSR of 12.7%.
This finding would suggest that, over the longer term, there doesn’t seem to be much of a relationship between the amount of investment and TSR. Nevertheless, in the most recent two rolling three-year periods in our study (2012-2014 and 2013-2015), we found an inverse relationship between reinvestment rate and TSR. Although the high reinvestment group had median reinvestment rates of 124% and 127% during the two periods and the low group had median reinvestment rates of 50% and 48%, the corresponding median TSRs of the high reinvestment group, 17% and 14%, were lower than the TSR of 19% provided in both periods by the low reinvestment companies. Thus, in recent years those tech companies that invested more delivered, on average, lower TSRs.
In sum, the trend of investing more for the sake of investing is not yielding the desired results in terms of shareholder return. And this begs the question: Why would a company have worse TSR if they invested more in the future?
According to our research, the capital deployment factor with the most explanatory power turned out to be the “quality” of the investments, which we attempted to quantify using a metric that we call “reinvestment effectiveness.” We defined reinvestment effectiveness as the increase in a company’s revenue over three years as a percentage of the cumulative investments made during that period. This measure appears
to provide a reliable indicator of whether there is an adequate amount of revenue growth—and presumably profits too—to justify the size of the corresponding investments.
What we found is that, regardless of how much they reinvested, tech companies that generate more revenue growth per dollar of investment had higher TSRs. The tier 1 companies with the highest reinvestment effectiveness had a median TSR of 24.3%, which was almost double the 12.5% median TSR of the tier 3 companies with the lowest reinvestment effectiveness.
Moreover, in contrast to the inverse reinvestment rate versus TSR relationship during the past two rolling threeyear periods, there was a strong positive relationship between reinvestment effectiveness and TSR during those same periods. The high group had median reinvestment effectiveness of 66% and 70%, respectively, and the low group had median reinvestment effectiveness of -10% and -4%—that is, even though they invested, their revenue declined. And whereas the high group had median TSR’s of 25% and 24%, respectively, the low group had median TSRs of 14% and 12%.
Thus, although the reinvestment rate doesn’t seem to relate well to TSR, reinvestment effectiveness appears to be very important. During the three years ending in 2015, Amazon ranked at the 55th percentile on the reinvestment rate, but they were in the 98th percentile on reinvestment effectiveness. Indeed, Amazon achieved roughly $300 of revenue growth for every $100 of reinvestment, which can be attributed to the quality and differentiation of their product and service offerings. In Amazon, we see a clear story of effective reinvestments being rewarded by investors with high TSR.
Counterintuitive Findings Regarding Stock Buybacks
Another important aspect of capital deployment is share repurchases, a common capital deployment tactic that has been used by many companies to boost short-term earnings per share. But does such a short-term boost necessarily lead to a sustainable, long-term rise in share prices?
We started to address this question in earlier research in which we came up with a set of metrics to quantify the payoffs of buybacks over a longer-term period. The main one, which we call “Buyback ROI,” is calculated as the internal rate of return of cash flows associated with buybacks. We also supplemented Buyback ROI with two other measures called “Buyback Strategy” and “Buyback Effectiveness.” Buyback Strategy takes into account TSR trends to help measure how much of the Buyback ROI metric is driven by the general movement in the company’s stock price over the period. Buyback Effectiveness—which is calculated as the difference between Buyback ROI and Buyback Strategy—then looks at timing of the buyback itself to help users determine whether or not the repurchases were timed optimally relative to the company’s share price. Said differently, are you buying when your stock is cheap, or when it is expensive? And how is this reflected in the subsequent return on your investment?
One interesting finding that came out of this previous research was that this strategy of buying back larger than average percentages of their own stock as a way to boost share price performance actually leads to lower TSR over time, when compared to companies that did not buy back as much of their own stock. This was eye-opening, as it seems to run counter to the original intention of boosting share price performance in the eyes of investors and analysts.1
For example, our most recent look at buybacks by tech companies shows that the top five technology companies in terms of Buyback ROI bought back a median of only 6% of their respective market capitalization, while achieving a median eight-quarter buyback ROI of over 40%. At the same time, the five arguably least effective repurchasers among tech companies in the same sample set bought back a median 29% of their respective market capitalization, with a median eightquarter buyback ROI of -44%. In other words, the companies that bought back lower amounts of their stock appear to have benefited more from those repurchase decisions.
Conclusion
The overall trend of growth-for-growth’s sake in the tech industry seems to have been restrained in recent years by a growing sense of the importance of making reinvestments more effectively. It is critical for the managers of tech companies to think like owners and assume responsibility for the balance sheet as well as the income statement when making business decisions. As we show in these pages, our measure of residual cash earnings (RCE) is a much more comprehensive performance metric—one that captures not only growth, but effective management of the balance sheet and efficiency in using investor capital. And our research has shown that, across the tech industry, RCE relates to TSR better than the traditional return and margin metrics more commonly used to assess company performance. Moreover, our case study of Amazon suggests that one of the important reasons RCE tends to be more highly correlated with the stock valuations is that RCE treats R&D as an investment rather than as a GAAP accounting expense.
Critics of approaches like RCE point out that few investors and stock analysts use RCE or measures like it. Though the critics are right, what they overlook is that all of the quantitative and qualitative factors they tend to pay attention to are effectively captured by and combined in RCE. Investors do evaluate the balance of growth and return, they compare returns to the cost of capital, and they understand that more capital-intensive businesses need higher margins to be successful. And it is very clear that investors understand that, in the context of equity valuation, R&D is an investment in the future and not a period expense. All of these factors are collected and balanced quite well in RCE.
As we also show in this article, Amazon is a highly instructive case study in value creation. Not only does RCE do a better job than most measures in tracking changes in Amazon’s market value, but it provides management with useful signals about the market’s perception, particularly with respect to the effectiveness of the company’s investment policies. Such signals can provide useful guides and incentives for management, especially when tied to executive compensation. For example, if management makes a large investment that doesn’t cover the required return, RCE will go down and we would expect the share price to drop as well. And in that case, management’s pay would go down too.
In sum, a performance evaluation and reward system based on increasing RCE holds out the promise of imposing accountability and encouraging managers to treat the capital of the company as if it were their own. The improved tracking of RCE to TSR also increases the possibility of raising the caps on compensation; since RCE is a more complete measure, boards are likely to feel there are fewer opportunities to improve the measure in ways that are not beneficial to the company. This provides an important opportunity to encourage reaching for stretch goals. With more accountability and more opportunity, RCE can help build a culture of ownership where managers act like they own the place.
Gregory V. Milano is founder and chief executive officer of Fortuna Advisors LLC and is founder, chief executive officer and chief investment officer of Fortuna Investors LLC, a registered investment advisor. Prior to this Greg was managing director and co-head of the Strategic Finance Group at Credit Suisse and before that he was partner and president of the Americas at Stern Stewart and Co.
Arshia Chatterjee is an associate at Fortuna Advisors LLC. After graduating from Yale University with a Bachelor’s degree in Economics, Arshia went on to earn a Master’s degree in Finance and Risk Engineering from NYU’s Polytechnic (now Tandon) School of Engineering. She worked in the valuation consulting space for two years prior to joining Fortuna.
Dave Fedigan is an associate at Fortuna Advisors LLC. Prior to Fortuna Advisors, Dave received his MBA from Georgetown University; and before that, he worked at the U.S. Chamber of Commerce in account management and strategy.
NOTES:
1. We have also begun to calculate and apply these metrics in a practical context every quarter by issuing a scorecard that ranks all of the companies in the S&P 500 on each of the above as well as various other relevant metrics (total dollars of buybacks, dollars of buybacks as a percentage of market capitalization, cash as percentage of market capitalization, percent change in earnings, etc). We calculate these measures over a two-year window, or the past eight quarters, and publish the ranking in Institutional Investor magazine.
