by Ryan Barker, BERA Brand Management, and Greg Milano, Fortuna Advisors
Many marketing programs turn out to be a waste of money—to restate the old John Wannamaker assertion, “half of the money I spend on advertising is a waste; the trouble is, I don’t know which half.” This may also be true with many brands. Some brands have powerful differentiation that has allowed them to expand into adjacencies (Amazon), protect their pricing power (Apple), and ultimately return value to their business and shareholders. But many other brands have been milked over the years with underinvestment in building and sustaining differentiation coupled with an exceedingly heavy emphasis on squeezing every drop of near-term sales and profits until they wither on the vine and are no longer able to return value to their business. The challenge is that neither marketers nor finance executives have been able to articulate a single analytical framework which both explains how and why brands come to flourish (or flounder) and how that brand growth contributes to the business’s short and long term bottom line.
In most organizations, finance controls the budget so, whether they like it or not, successful marketing executives have long known that getting along with finance is necessary for their own career success. But in most cases, this just means being cordial and friendly, not true collaboration. For those marketers that have tried to explain how marketing works to financial colleagues, they often find there is indeed an understanding of marketing’s goals and an appreciation for their importance, until it comes down to actually spending more money to achieve a marketing goal such as improved brand differentiation.
Given the inability of marketing teams to explain how brand building “works,” let alone estimate the long-term financial impact of marketing investment, far too often the finance team demands an immediate or very quick payback. After all, why would we spend money that makes our profits decline? If we spend a million dollars on marketing and we don’t get enough immediate new sales growth to drive at least a million dollars of incremental profit contribution, aren’t we worse off? Almost all finance people today understand the value of the long term and they know how to forecast cash flows and calculate net present values, which is how they evaluate almost all capital outlays. But unfortunately, in many companies, the analytical gap and fundamental lack of a common language between marketing and finance simply reinforces the accounting and control functions that are driven by the quarterly cycle (short-termism) so that decisions are often made that the finance staff themselves know do not maximize value.
The magnitude of value lost through this short-termism is astounding. In a widely-read article published in the Financial Analysts Journal, Professors Graham, Harvey and Rajgopal showed that “the amount of value destroyed by companies striving to hit earnings targets exceeds the value lost in recent high-profile fraud cases.”2 The press likes to talk about scandals like Enron, but these professors found that the problem of short-termism could easily be costing as much as two Enrons. And short-termism is a problem every year, not once in a while, and to at least some degree in almost every company.
Short-termism is a way of life at many companies, perhaps at most companies. When organizations lose their way, these institutionalized norms take over and it takes a shock to the system for any meaningful strategic reform to take hold. In 2006, the leadership of activist investor Trian Partners distributed a position paper3 describing their vision for H.J. Heinz Company. The popular press usually describes activist investors as being ruthlessly short-term while corporate executives are long-term, but the Trian argument showed quite the opposite was true.
Trian emphasized that Heinz is one of the most valuable brands in the world:
…in the same way that consumers might question the quality of a restaurant that serves a cola other than one of the two leading brands, consumers often question the quality of the food at a restaurant that does not have Heinz on its tables.
But the activist lamented the poor Heinz share price performance and emphasized poor capital allocation decisions and the ineffectiveness of management to reinforce and build this valuable brand asset. They noted how
…Heinz has failed to properly invest in its “power” brands and has increasingly competed on price, to the detriment of long-term growth and overall brand health. As a leading consumer products company, Heinz must make marketing and innovation its core competency and top priority. Management should reduce deals, allowances and other trade spending to retailers by at least $300 million, or approximately 3%, over a period of time and should reinvest these funds in the Company’s brands through increased consumer marketing and product innovation. We believe that these changes would at least double Heinz’s current advertising budget and help grow the market for Heinz’s products.
It shouldn’t take an activist investor to get executives, and in particular chief financial officers and their staffs, to understand the importance of brand value in determining financial performance, valuation and shareholder returns.
We shouldn’t just turn over the keys to the marketing department either. Indeed there have been many examples of wasteful marketing expenditures, such as the discovery by P&G earlier this year that they were wasting hundreds of millions on unviewed and fraudulent digital advertising. Once they had adequate transparency from the major digital platforms, they realized ad view times were exceedingly short and some people were seeing far too many ads. For decades, marketing resources have been allocated using allocated using an approach known as Market Mix Modeling (MMM), which uses statistical analysis of periodic marketing, sales and other data to estimate the near-term volume impact of raising, lowering, or shifting marketing resources across channels and tactics. Advocates wax eloquently about how the approach increases the effectiveness of marketing allocations, but it is reliant on historical data to forecast consumer response (past as prologue) and is targeted at driving a short-term sales lift without regard to costs and margins, capital investment requirements or, most importantly, the implications for brand value. Like Heinz before Trian arrived, many companies that use marketing mix modelling overemphasize short-term deals, allowances and other trade spending at the cost of brand building and ultimately sustained, profitable, long-term growth and value.
There is a better alternative. The very best elements of financial management and marketing management can be merged into a collaborative strategic resource allocation framework that seeks to simultaneously optimize the drivers of sales growth, the value of sales growth and the sustainability of sales growth in order to drive the highest possible total shareholder return (TSR), including both dividends and share price appreciation. But before we get to that, we need some tools that allow us to quantify, compare and make tradeoffs between the financial and marketing elements.
How Brands Affect Financial Performance and Valuation
Over the last few years, BERA Brand Management (BBM) has developed one of the largest brand-equity assessment platforms in the world, capturing 1 million consumers’ perceptions across over 4,000 brands to explain and quantify not only how brands grow but how brand growth translates to financial performance including valuation. BERA, which stands for Brand Equity Relationship Assessment, is built around a battery of 100+ metrics rooted in behavioral science and market research. While traditional marketing wisdom emphasizes awareness and stated consideration and preference for a brand, BERA has found that these offer an incomplete picture of the complex and often irrational dynamics of consumer choice. Awareness and funnel metrics, like consideration and preference, are informative but tend to be lagging indicators of business growth in that they follow sales or at best provide contemporaneous indications. These metrics don’t capture the underlying drivers of that intent or consideration and this makes them far less actionable for driving brand optimization and less useful to validate, predict and orient investment in the brand. Instead BERA has developed a multi-dimensional brand model that consists of both lagging indicators, which explain how a brand contributes to a brand’s market share or revenue TODAY, and leading indicators that explain and predict how a brand contributes to TOMORROW’s sales volume and pricing power. It is this combination of leading and lagging indicators which makes the BERA framework ideal for bridging marketing with financial analytics.
We can think of these lagging and leading indicators as two overarching metrics or scores—“Today” and “Tomorrow.” Today is a combination of Familiarity, which reflects the depth of awareness (e.g. is the brand a household name) and Regard, which indicates how highly consumers regard the brand. We can think of this Today score as a way of measuring how a brand contributes to today’s revenue. The Tomorrow score is built from measuring a brand’s Uniqueness and Meaning, or relevance. In a cross category analysis, Uniqueness has been shown to correlate highly with a consumer’s willingness to pay a premium, giving us a measure of how a brand lessens pricing sensitivity. The Meaning score indicates how meaningful or relevant a brand is to a consumer’s life, which drives potential volume by signaling the number of occasions that service or product can be used or purchased.
A brand’s Tomorrow score, indexed to the average score for the category, is an objective measure of brand differentiation which is the most important component of brand strategy as it provides a measure of risk associated with the brand’s revenue streams. Although both the Today and Tomorrow scores relate well to revenue growth, it is the ratio of the Tomorrow score to the Today score that aligns best with overall profitability, valuation and TSR. It seems the important brand attribute is not total awareness, but rather that a large proportion of those that are familiar with a brand believe it is unique, in comparison to competitive offerings, and meaningful to them personally. Put slightly differently, it is much easier to solve an awareness problem than to solve a differentiation challenge.
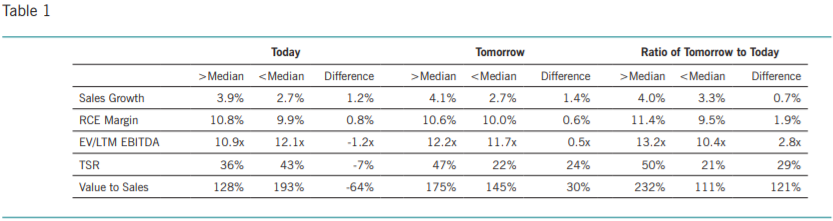
In order to evaluate the relationship of these brand metrics to financial performance, we studied over 160 publicly owned monobrand companies, which are those where the majority of the revenue comes from a single brand, such as CocaCola, Delta Airlines, or Facebook. The study used three year financial and share price data from 2015 through 2017 and valuation data as of the end of 2017. The brand attributes were based on the total US adult population for the full calendar year 2017. The discussion in the following paragraphs is summarized in Table 1.
Marketing places a heavy emphasis on revenue growth, so we examined the relationship of the BERA scores to revenue growth. It wouldn’t surprise most people that better brands tend to grow faster, but to confirm this empirically, we split the monobrand companies into above and below median groups based on the Today score and calculated the median revenue growth for each group. The monobrand companies in the top Today group have 1.2% more median revenue growth than the low group. We separately sorted them on the Tomorrow score, and the top group delivered an extra 1.4% revenue growth. Top line growth is an important driver of TSR, so the findings that the Today and Tomorrow brand scores strongly relate to revenue growth is important.
The Ratio of Tomorrow to Today also showed a positive, but smaller, relationship to revenue growth, with the above median ratio companies having median growth just 0.7% higher per year than the below median ratio companies. As important as revenue growth is, growth for growth’s sake isn’t of much value. Some brands with low differentiation achieve decent revenue growth at the cost of excessive promotion or price competition, which doesn’t do much for shareholders. Many marketing decision processes focus heavily on revenue growth and, coupled with measurement frameworks lacking a long-term component, do not create much value for shareholders.
The relative value of growth can only be understood in connection with some profitability measure. There are many measures of profit margin, cash flow margin, rates of return and economic profit that each provide an indication of relative profitability, but the vast majority of them are either incomplete or are otherwise biased and flawed. To decide which brands are more valuable to grow requires a comprehensive performance measure that properly reflects revenue versus the total cash cost of sales, including the cost of capital.
In 2009, Fortuna Advisors developed Residual Cash Earnings (RCE),4 which is calculated after all cash operating costs, taxes and the required return on capital. Most measures of economic profit and return reinforce underinvestment by making investments look worse when they are new. As assets age and depreciate away on the accounting books, these measures rise and give the illusion of value creation, which encourages milking old assets well beyond their useful lives. RCE fixes this by displaying more uniform performance over the life of an investment, which creates more incentive to invest in growth and also to replace old assets that have passed their prime. In RCE, R&D is capitalized as an investment, which also improves the pattern of RCE over the life of an investment or business. Marketing investments in advertising could be similarly capitalized in a custom internal version of RCE, but since there is no standard way of reporting such information in accounting statements, we cannot do so with external data.
Investors care about growth, profit margins and capital intensity, and all of these performance attributes are incorporated in RCE. As would be expected from such a comprehensive measure, there is a much better relationship between TSR and changes in RCE than there is with other less complete financial performance measures. So the RCE and RCE Margin of a brand is an important signal of value creation. It is not uncommon for some brands to have five or ten times the RCE Margin of other brands, which means they create five or ten times the amount of RCE per dollar of sales growth. Knowing this helps companies go beyond the myopic objective of sales growth maximization and consider the differences in true profitability that make some sources of sales growth worth more than others.
The median RCE Margin for the monobrand companies with an above median Ratio of Tomorrow to Today is 11.4%, which is 1.9% higher than for the low ratio companies at 9.5%. So for each dollar of sales growth, the highly differentiated companies deliver 20% more RCE (simply 11.4%/9.5% – 1).
Knowing revenue growth and the level of profitability is very important, but to understand the complete impact on the value of the shareholder’s investment we must also include valuation multiples. There are many measures of valuation, but we chose to use the ratio of the enterprise value of the company, which is the total value of equity and net debt, divided by the earnings before interest, tax, depreciation and amortization (a.k.a. EBITDA) over the trailing four quarters. This is often just called the ‘EBITDA multiple,’ and it has the virtue of measuring the valuation of the total company without regard to debt leverage or other financial policies, which is appropriate for the linkage to brand value.
The median EBITDA multiple for the monobrand companies with an above median Ratio of Tomorrow to Today is 13.2x, which is 2.8x higher than for the low ratio companies at 10.4x. So for each dollar of EBITDA, the highly differentiated companies deliver 27% more Enterprise Value (simply 13.2x/10.4x – 1).
Financial performance and valuation multiples are important but investors care most about TSR as it indicates the increase in the value of their investment over the period as a percentage of the starting value. With more revenue growth, higher RCE margins and higher EBITDA multiples, it is expected that TSR would be higher for the companies with a higher Ratio of Tomorrow to Today and indeed it is so. The median TSR of the more differentiated companies was 50% per year over the three-year period, which is over twice the median TSR of the less differentiated companies at a mere 21%.
Corporate finance experts may shun value to sales measures as inferior indicators of success that ignore profitability and are often used to ascribe value to unprofitable businesses that cannot otherwise be explained. We agree care must be taken in using value to sales ratios, but we do see an attractive application in strategic resource allocation. Considerable time and effort have been put in over the years to develop marketing mix models that predict changes in revenue based on product market and media mix inputs. Value to sales ratios can help us understand the relative value of growth in different brands, or even in different regions or channels for a single brand, so instead of maximizing revenue we can now seek to maximize brand value creation.
In short, we see the value to sales ratio as a useful bridge between marketing and finance—marketing tends to focus on how marketing spend impacts sales by understanding the drivers of the value to sales ratio; finance can augment the analysis to determine the likely impact of marketing spend on brand value. The value to sales ratio tends to be higher in companies with high revenue growth and high RCE margins. Valuation being forward looking, it also includes the aggregate investor assessment of the sustainability of revenue growth and RCE margins. Insofar as the sustainability of revenue growth is a driver of valuation, brand differentiation drives valuation through limiting any risk attached to this sustainability. The median value to sales for the monobrand companies with an above median Ratio of Tomorrow to Today is 232%, which is 121% higher than for the low ratio companies at 111%. So for each dollar of sales, the highly differentiated companies deliver over twice the value.
Strategic Resource Allocation
Corporate success is often limited by suboptimal Strategic Resource Allocation (SRA), which includes the allocation of capital, marketing and R&D investments, as well as acquisitions, debt repayment, dividends and stock repurchases. We will focus on the allocation of marketing resources.
To improve the allocation of advertising, promotion and other marketing resources requires a change of mindset from increasing revenue growth (a.k.a. sales lift) to maximizing the value of the business in which the brand sits. Some brands deliver so much more value per dollar of sales that management should prefer to add $1 million of sales in the more valuable brand rather than to add $2 million of sales in other brands with lower value to sales ratios.
To understand how significant this can be, consider that at the end of 2017 the enterprise value of Dillard’s was only 38% of its 2017 revenue, while for Activision Blizzard this was 693%, so each dollar of sales growth in Activision Blizzard is worth about 18 times a dollar of Dillard’s sales. A mere $55,000 of Activision Blizzard sales is worth as much as a million dollars of Dillard sales. If these were two businesses within the same company, the optimal revenue growth focus of most marketing mix models would likely prescribe resource allocation that would be very suboptimal for shareholders.
Corporate financial theory dictates that management pursue all investments that create value and turn down all those that destroy value. A common technique for this is discounting free cash flow to a net present value, or NPV. The present value of RCE can also serve as an NPV. Either methodology works in principle, but is dependent on the accuracy of the forecast. When managers present budgets for approval that they will later be measured against, they often sandbag the budget to get an easy to beat profit target. When they present long-term forecasts, they tend to be more optimistic as they want their resource requests to be approved. These sometimes overly optimistic and pessimistic forecast biases can be so biased that they render the budgets and forecasts useless for resource allocation decision making.
BERA’s framework for quantifying brand growth can provide a very useful check on the forecast, or can even be the basis for the forecast. Do the estimates for growth, RCE margin and valuation multiples seem consistent with the brand scores of Today, Tomorrow and the Ratio of Tomorrow to Today? Does the value to sales implied by the valuation seem consistent with the brand scores? The following case study presents one way to use brand data to evaluate strategic resource allocation choices.
A Hypothetical Case Study Based on Real Brands
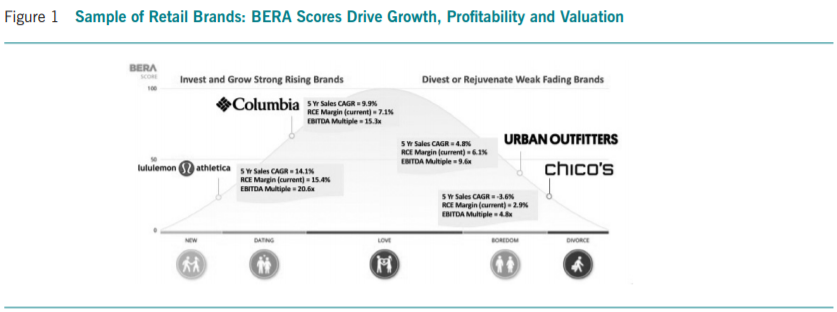
The differences in brand scores can be quite significant even within the same industry, as four very different retail brands will show. Columbia Sportswear designs and markets outdoor and active lifestyle apparel and related items. Urban Outfitters is a retailer and wholesaler of women’s and men’s apparel, home goods, electronics, and beauty products, with a focus on the growing millennial segment. Chico’s FAS is a specialty retailer of women’s casual-to-dressy clothing and accessories. Lululemon Athletica designs and distributes athletic and athletic leisure (a.k.a. athleisure) apparel for women and men. Several of these companies operate multiple brands but for the purpose of simplicity in this hypothetical case study, we only included brand information on each company’s primary brand.
Based on BERA’s data, Columbia Sportswear scored the highest on both Today and Tomorrow, but Lululemon Athletica has the highest Ratio of Tomorrow to Today, followed in order by Columbia Sportswear, Urban Outfitters and Chico’s. Figure 1 shows these four brands on the BERA Love Curve.
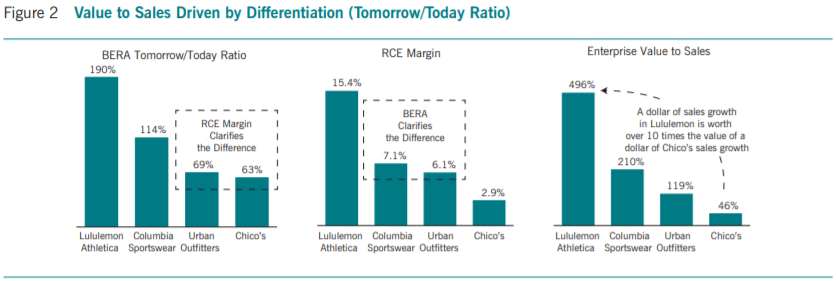
We can see the importance of the Ratio of Tomorrow to Today as this is also the very same ranked order of these companies based on five-year revenue growth, current RCE margin, EBITDA multiple and value to sales. As can be seen in Figure 2, together the Ratio of Tomorrow to Today and the RCE margin explain the differences in value to sales for these four companies. The Ratio of Tomorrow to Today is very similar for Urban Outfitters and Chico’s, but the difference in RCE margin is why the difference in value to sales is material. Similarly, Columbia Sportswear and Urban Outfitters have similar RCE margins, but the difference in the Ratio of Tomorrow to Today explains the difference in value to sales. Neither the marketing nor finance measure is complete on its own.
To demonstrate the usefulness of strategic resource allocation realistically, using both marketing and financial inputs, we simulated a hypothetical, single, multi-business apparel retailer with four business units resembling the four separate companies described above. We turned back the clock and started the simulation five years ago to consider a series of strategic choices that could have been made.
For the year ending January 2014 (FY13), we aggregated the revenue, RCE and enterprise value to get a consolidated starting point for our simulation and against this we considered various options. In essence we are simply assuming any corporate cost that is needed at the holding company level in order to manage the portfolio is exactly offset by the cost reduction available in the businesses by only running one public company instead of four.
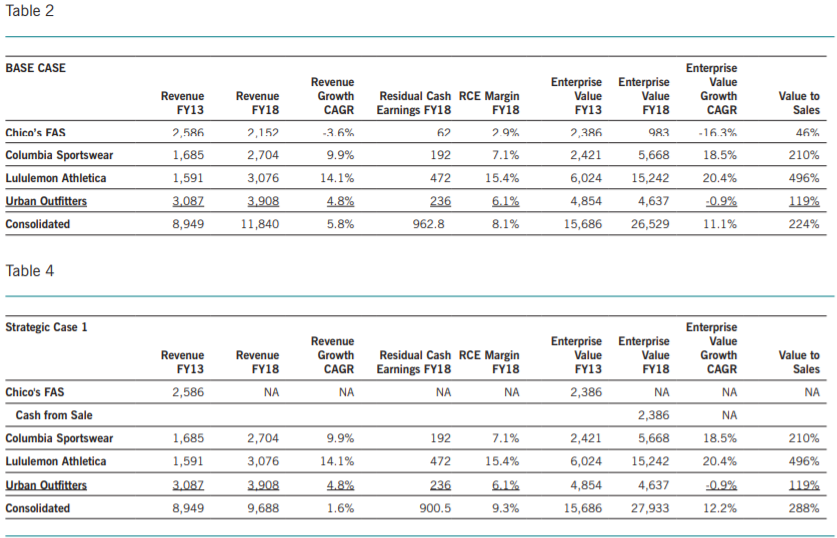
The first option is a ‘base case’ whereby each of the four businesses performs as the executives have run them and they experience value growth that is exactly as the separate companies have been valued. We used the current financial year (FY18) as the end point of the simulation with consensus revenue and EBITDA driving the results and we summed the current valuations up as a simple sum of the parts. Table 2 illustrates the key financial information.
The consolidated results for this hypothetical company show 5.8% annualized revenue growth and an 8.1% RCE margin, with both metrics heavily benefitting from the performance of Lululemon Athletica. Two of these companies were worth less at the end of the 5 years than they were in the beginning, but the value creators outpaced the others so the aggregate enterprise value increased by 11.1% per year.
Things get interesting when we start making strategic moves to change the portfolio. If we had expected such a downturn in Chico’s, we would have benefitted from selling it at the start of the 5 year period, before the value slide, even if we didn’t get any acquisition premium and we just held onto the cash. This decision could have been influenced by the fact that as early as 2Q13 BERA’s tracking showed a decline in Tomorrow scores for Chico’s. Table 4 shows Strategic Case 1, which illustrates the impact of this sale with the cash proceeds included as part of the enterprise value for illustration.
Note that revenue growth and RCE are lower, while RCE margin is higher. The ending enterprise value rises from the base case by $1.4 billion and the annualized growth in enterprise value rises from 11.1% in the base case to 12.2% with the strategic divestiture.
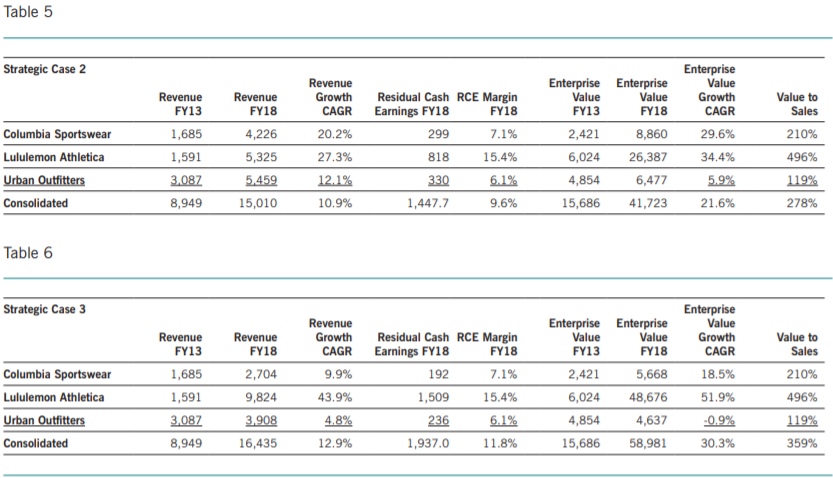
Of course our hypothetical company could reinvest the cash received from the sale of the Chico’s business unit. Strategic Case 2 reflects the equal allocation of one third of the proceeds from selling Chico’s across each of the remaining businesses, which all have a higher Ratio of Tomorrow to Today which, together with higher RCE margins, drives higher EBITDA multiples and value to sales ratios. For simplicity, we assumed that as we invested more, each business would maintain its brand characteristics, capital turnover, margins and valuation. Finally, sensitivity analysis shows that even if we achieved only half the historical value to sales in each business, Strategic Case 2 creates substantial value for shareholders compared with the baseline and Strategic Case 1. Table 5 shows the key financial elements of Strategic Case 2.
Revenue growth has now jumped to 10.9% per year which, when coupled with a further expansion in the RCE margin due to the change in business mix, leads to FY18 RCE that jumps from $963 million in the base case to $1.45 billion in Strategic Case 2, an increase of 50%. And by replacing the capital committed to Chico’s with its lower Ratio of Tomorrow to Today, EBITDA multiple and value to sales ratios, and redirecting these resources to better performing brands, the enterprise value rises by over $15 billion from the base case and the annualized value growth rate jumps from 11.1% in the base case to 21.6% in Strategic Case 2.
Strategic resource allocation is optimized when resources are allocated to their highest valued use. It may very well be that an even better allocation is available by allocating a larger percentage of the capital from the Chico’s sale to Lululemon Athletica, with its very high Ratio of Tomorrow to Today, revenue growth, RCE margin and valuation. Although Urban Outfitters and Columbia Sportswear have value to sales ratios over two times and four times that of Chico’s, respectively, they pale in comparison to the Lululemon Athletica value to sales ratio, which is over ten times that of Chico’s.
Strategic Case 3 is an extremely concentrated allocation whereby Columbia Sportswear and Urban Outfitters perform as in the base case while 100% of the proceeds from the sale of Chico’s is invested to grow the marvelous brand of Lululemon Athletica. The results are staggering, as shown in Table 6.
This case may go beyond what is reasonable in a real situation, but it does show how important it is to get the investment and growth strategy right for the strongest brand. One of the most common flaws in strategic resource allocation is to spread investment relatively evenly across businesses with only slight deviations based on performance and opportunities. When strategic decisions are based on gut feel and intuition, rather than fact-based analysis, the tendency is to be very balanced rather than concentrating resources where they can do the most good. Having access to the Ratio of Tomorrow to Today brand score and RCE Margin provides the necessary insights on the value to sales ratio that makes it possible to have fact-based marketing resource allocation decisions that optimize value creation. The confidence of management improves when the facts are so clear.
Thus far we have explored resource allocation across branded businesses that generally maintain their brand and financial characteristics as they scale up or down. Another very important reason to allocate resources to a brand is to grow their brand’s health or “power.” For example, what if the Urban Outfitters brand management team had a well thought out comprehensive strategy for growing the brand’s health and they set their sights on matching the Today and Tomorrow scores of Columbia Sportswear?
BERA’s data is like a “GPS” for orienting Urban Outfitters brand growth so that it could achieve the same level of performance and valuation as Columbia Sportswear. Key to this will be growing Urban Outfitters Tomorrow Score or in marketing-speak—building a more differentiated brand. This differentiation would in turn reduce risk around the brand’s revenue stream and provide more sustainable revenue growth, ultimately increasing the brand’s value.
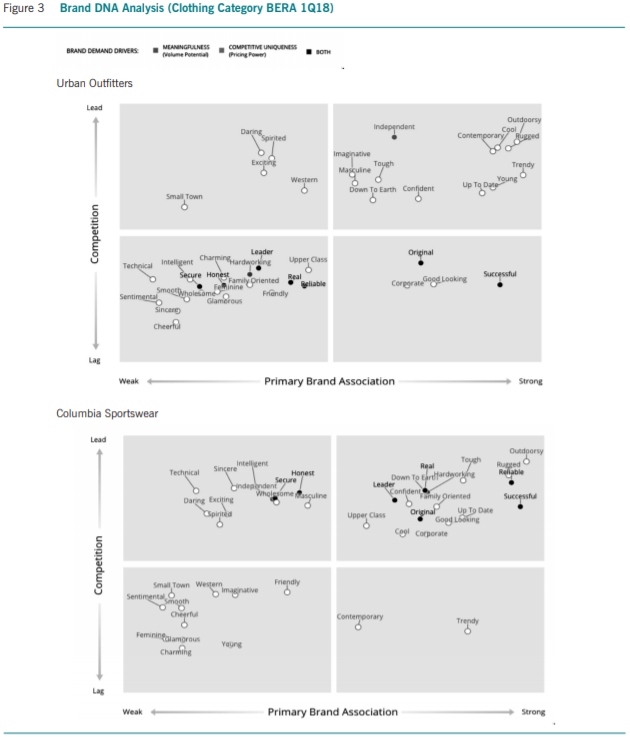
As outlined earlier, the Tomorrow score is comprised of two metrics, Uniqueness and Meaningfulness. While these are useful constructs for quantifying a brands overall health across all sectors, what it means to be Meaningful and Unique is particular to each brand and sector. To address this, BERA has developed a battery of emotional and imagery traits whose associations with each brand can be measured and benchmarked to define Uniqueness and Meaning for each brand. These traits can be thought of as a brand’s DNA, or the building blocks of association which form our impression of a brand within our structure of memory and opinion formation. Put simply, to move the needle on Meaning and Uniqueness we must change what people associate with the brand. Figure 3 shows the Brand DNA for Urban Outfitters and Columbia Sportswear.
A regression analysis against the broader clothing and retailer category identifies which trait associations correlate most strongly with higher Meaningful and Uniqueness scores. These have been highlighted in Green and Blue respectively. The position of each trait can then be plotted by measuring the degree to which that attribute is associated with the brand and then comparing that against the competition to measure differentiation for a given trait. The output is a 2 by 2 matrix with a brand’s core DNA appearing in the top right corner. Brand’s with higher Tomorrow score will have more of the colored “brand driver” attributes in that quadrant. Here we can quickly see just how much stronger a brand Columbia is, owning 6 of the 9 traits which are drivers. Urban Outfitters, on the other hand, only owns a single attribute. To revitalize the Urban Outfitters brand and build a higher Tomorrow score they should prioritize investments which will build associations with the colored driver traits. “Original” and “Successful” would make ideal candidates as they are already strongly associated with the brand, they just lag behind the competition. This allows for a data-driven and evidence-based approach to prioritizing brand investments. All too often the brand brief, which guides marketing’s investment in building a brand, is based on institution, or worse, historical associations, with the brand. In the case of Urban Outfitters the brand is already seen as Cool, Contemporary, Trendy, and Young, but further investment in building these traits is unlikely to drive the Tomorrow score higher.
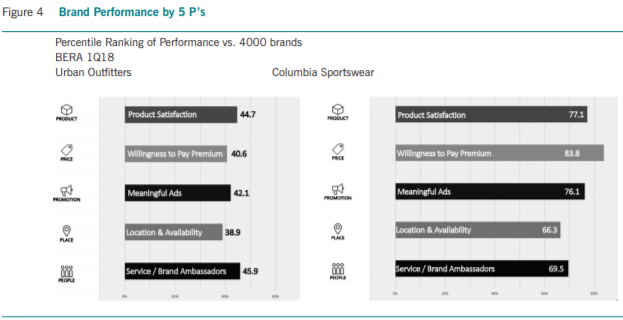
BERA’s data also provides us visibility into which of the classical 5Ps of marketing is contributing most to the brand. For the finance readers, the 5Ps are product, price, promotion, place and people. This can be used to further prioritize investment strategies, as shown in Figure 4.
Looking across the 5Ps we again can see Columbia’s strong brand coming through particularly in “Price” or a consumer’s willingness to pay a premium for that brand. BERA’s database of 4000 brands enables the scores to be expressed as percentile rankings against all brands so that for example Columbia Sportswear can be said to be in the 84th percentile or the top 16% of all brands in the US in terms of pricing power. Looking at Urban Outfitters, we can see that “Price” is their 2nd lowest of the 5Ps with plenty of room to grow as is their score for promotion, which here tracks consumer’s perceptions of the ads as being relevant or meaningful. As said before, building awareness is an easier problem to solve. It is a much more difficult challenge to deliver advertising that is “on brand” and perceived as meaningful and relevant. Money can buy you awareness but it can’t buy you love. However, with the aids of concept testing and creative pre-testing, the right message and creative content can be tested and identified before putting a large paid media budget behind it, ensuring that the investments are made with the highest likelihood of achieving the desired outcome.
While this example is an oversimplification, it should demonstrate that a data driven approach can be used to bridge “soft” marketing metrics with financial analysis ensuring that marketing investments drive value.
Imagining a Chief Marketing Officer would propose such a plan for investment, the Chief Financial Officer should want to know if such an investment in rejuvenating the brand is worthwhile. That is, would it create value for shareholders? To simulate such an analysis, we began by establishing a baseline forecast for Urban Outfitters with no change in brand investment. If we were the actual brand managers, we would build a well thought out bottom up baseline forecast of volume, price, cost and investments in capital and marketing programs. To keep it simple for this illustration, we simply assumed revenue growth, RCE margin, EBITDA multiple and the value to sales ratio remain the same for the next five years as they were for the last five years. Given this baseline forecast, the enterprise value of Urban Outfitters would be expected to grow by $700 million, or 15% over five years. This isn’t great but it would be an improvement versus the -0.9% over the last five years.
Next we would build the business case and forecast for the brand rejuvenation strategy. Again, if we managed the brand, this would be a very comprehensive bottom up process, but to keep it simple we are going to make the simple assumption that if we could improve the Urban Outfitters’ brand Today and Tomorrow scores to match Columbia Sportswear, then we could achieve their level of revenue growth, RCE margin and valuation. Instead of growing the enterprise value over the next five years by 15%, this case creates nine times the value and grows enterprise value by 135%.
But this just reflects the benefits of rejuvenation without the cost of achieving it. There would likely be substantial required investments, with some capital expenditures and marketing expense, but for simplicity we assumed the investment is all cost that would be expensed against EBITDA and RCE. We then solved for the amount of EBITDA decline, due to investing in the brand, that could be incurred before the enterprise value improvement faded to the 15% in the base case forecast. It turns out that on top of the existing marketing spend, Urban Outfitters could deploy an extra 7% of sales to achieve the brand rejuvenation, which is over $350 million in year five. We would need a more comprehensive rejuvenation plan to evaluate this investment, but it seems reasonable that if the plan made sense strategically, it is likely to cost less than this breakeven amount and therefore would be expected to create value.
Merging Marketing and Finance
To merge the best of marketing and finance requires the simultaneous use of enhanced measures of both brand health and financial performance in order to better allocate capital and marketing resources to optimize value creation. Hopefully the ideas and illustrations herein provide a useful step towards marketing and finance executives finding a common language. Much has been written lamenting and calling for such a language but there is still much to be done—mostly in quantifying and expressing in financial terms some of the “softer” aspects of marketing such as brand building.
Undoubtedly, brand building is both an art and a science. But, just as we must teach the artists to speak in accounting terms at least 4 times a year, the finance people can develop an evidence-based framework explaining how some of the “softer” investments, such as brand building, contribute to the bottom line and the value of the firm. Marketing executives must then use that framework to explain clearly to the finance people how the fundamental mechanics of brand building creates value.
Ryan Barker is Managing Partner at BERA Brand Management, the largest brand equity assessment platform in the world.
Greg Milano is founder and chief executive officer of Fortuna Advisors, an innovative strategy consulting firm that helps deliver superior Total Shareholder Returns (TSR) through better strategic resource allocation and by creating an ownership culture.
1. Elsewhere in this issue, authors Graham D. Barr, Theodor J. Stewart and Brian S. Kantor cite Systems Theory founder Jay Forrester: “omitting structures or variables known to be important because numerical data are unavailable is actually less scientific and less accurate than using your best judgment to estimate their values. To omit such variables is equivalent to saying they have zero effect—probably the only value that is known to be wrong!’’
2. See John R. Graham, Campbell R. Harvey, and Shivaram Rajgopal, “Value Destruction and Financial Reporting Decisions,” Financial Analysts Journal, Vol. 62, No. 6, pp. 27-39, November/December 2006. Available at SSRN: https://ssrn.com/abstract=953059
3. https://trianpartners.com/content/uploads/2017/01/TRIAN-WHITE-PAPER-Heinz.pdd
4. See Gregory V. Milano, “Postmodern Corporate Finance,” Journal of Applied Corporate Finance, Volume 22, Issue 2, Spring, 2010.
