In early 2018, Institutional Shareholder Services (ISS), the well-known proxy advisory firm, announced that it had acquired EVA Dimensions, an equity research firm that uses economic value added (EVA) to measure corporate performance and estimate a company’s intrinsic value. Following this acquisition, ISS also announced that in 2019 EVA would be featured in its research reports along with GAAP-based measures—and that in 2020 it would consider making EVA-based measurements part of the financial performance assessment methodology for its pay-for-performance model. Those of us who have been studying performance measurement and compensation design for decades applauded the news.
But not all were as enthused about this development, as I recently found out when I attended a WorldatWork conference in Colorado focused on trends in executive compensation and performance measurement. Though many topics were discussed, a common thread running through many presentations was that EVA was undergoing a resurgence—and every expert warned that human resource professionals should be deeply concerned about its impending return. The most common complaint was about the complexity of the EVA performance measure, but some also cautioned against its tendency to encourage “underinvestment.”
Yet, having implemented EVA with Stern Stewart for over ten years beginning in 1992, I can say with some confidence that EVA is a more effective way of guiding and motivating corporate managers to create value than traditional performance measures. It was a substantial step forward in the evolution of performance measurement in that it attempts to balance considerations about both “quantity” (or growth) and “quality” (rate of return, or profitability) within a single measure. Sure, there are improvements that can be made to simplify EVA and encourage better behavior, which will be discussed below. But it was a major advance in performance measurement when it was launched about 30 years ago.
But before getting into the specifics, let me provide some context for what follows. In 2001, when Joel Stern and John Shiely published The EVA Challenge: Implementing Value Added Change in an Organization,3 they asked me to write the epilogue, which came to be titled “EVA and the ‘New Economy.’” The authors wrote the book during the dotcom bubble, and the epilogue was my early attempt to explain corporate valuation in situations where corporate investments more often took the form of R&D and marketing expenditures than traditional capital spending on buildings and machinery. As I wrote back in 2001, “Do not be distracted by the values of new economy companies. The share prices may be realistic or they may be a dream; we do not know. However, …[a]t any reasonable percentage of prevailing valuations, this would be an NPV-to-capital ratio that many ‘Old World’ companies would cherish.”
A year earlier, in 2000, I gave a speech at Stern Stewart’s second European EVA Institute in Fiuggi, Italy that was later adapted into an article titled “EVA and Growth” and published in Stern Stewart’s EVAngelist magazine.4 As I pointed out in my speech, although EVA theoretically encourages all good investments insofar as it rewards the delivery of returns above a weighted average cost of capital, with many clients I had witnessed EVA stifling growth investment and causing managers to place too much emphasis on cost efficiency and capital productivity. The speech and article were my first attempts, while I was still at Stern Stewart, at explaining the behavioral reasons for these unintended consequences of an otherwise good idea.
Then, in 2004, I joined the “Buyside Insights” Group of the Credit Suisse investment banking department shortly after they had acquired the HOLT® valuation framework.5 HOLT is a highly sophisticated framework for valuation, which is to say that it’s very complicated. It’s great for investors, who tend to be a very numerate lot, but has proven to be cumbersome for corporate management teams. Worth noting here, though, is that HOLT is “cash-flow based,” so it doesn’t recognize depreciation as a cost and assets don’t decline in value as they get older. It was during this period that I realized that depreciation was at the root of one of the biggest problems with EVA. By making new assets look more expensive than they really are, and by creating an illusion of performance improvements as those assets depreciate away, the conventional accounting for depreciation causes distortions in the timing of EVA—and of virtually every return measure, including ROE, ROIC, and ROCE. I will come back to this later, but for now, suffice it to say that depreciation was a key to solving the puzzle of why EVA appeared to be discouraging new investment.
It was these shortcomings of EVA that ultimately led our Fortuna Advisors team to develop a better economic profit performance measure when we founded our corporate shareholder value advisory firm in 2009. The process began with extensive empirical testing to refine our ideas and develop a simpler economic profit measure that does a better job of tracking total shareholder return and, more important, strikes a better balance between delivering current performance and investing in the future. The result was Residual Cash Earnings (RCE), which was introduced here in the Journal of Applied Corporate Finance in 2010.6 We have implemented RCE for many companies since then, in most cases customizing the measure (and often renaming it after the company) to fit different businesses and industries. In the sections that follow, I will explain how both EVA and RCE are calculated as well as how RCE differs from EVA by providing management with the performance indicators and incentives to pursue an optimal balance of profitability and value-adding investment.
Overview of EVA
In the 1990s, EVA was all the rage. One would hardly have known that economic profit had been developed in academia over 100 years earlier. Of course, the formula for EVA reflected a specific definition of economic profit that was developed and popularized by Stern Stewart & Co. EVA is simply Net Operating Profit after Taxes (NOPAT) less a capital charge to reflect the expected return of the shareholders and lenders on the capital they have committed to the company. But to adjust for some of the idiosyncrasies of accounting, and presumably to improve the quality of the performance measure, calculating EVA requires a stream of adjustments to GAAP accounting that make the metric significantly more complicated to understand and implement. According to the Wikipedia page for EVA, there are over 160 potential adjustments.7
On the one hand, this plethora of adjustments in the hands of corporate finance departments has made EVA more comprehensive and robust—but at the cost of making the measure harder for managers to understand. And as a general rule, if people do not understand a financial measure well, it is much less likely to motivate their behavior—at least in the way it was designed to. Along with the complexity, there is also a short-termism problem that is potentially far more destructive to the pursuit of shareholder value. To understand why EVA motivates short-term behavior, let’s consider the three main ways that EVA leads managers to increase value:
Motivation #1: Improving current performance by optimizing pricing, cost management, and capital utilization.
Motivation #2: Investing in all new projects that generate sufficient NOPAT to more than cover the capital charge.
Motivation #3: Harvesting low-return investments and diverting the resources toward EVA-enhancing activities.
In my experience, most EVA-driven companies do a fair job on the first and third motivations, but the vast majority underinvest in the business, and so the second motivation doesn’t usually work out as intended. The result is often less profitable growth and a tendency to cut expenditures related to maintaining and upgrading aging assets. This is known as “sweating assets,” and some finance managers commend such tactics. Unfortunately for shareholders, though, our research shows a negative relationship between sweating assets and TSR.8
Beyond EVA
To build a better mousetrap, we sought a deeper understanding of the problems with EVA that we were trying to fix. It was obvious that the ideal measure needed to be simpler than EVA, with fewer adjustments to accounting; but it took me the better part of a decade to figure out the ways in which EVA was discouraging corporate investment. Now it seems so clear.
It is easiest to see the bias against capital expenditures by considering a single new investment of $1 million in an asset that has a five-year accounting life, and an average useful service life of about seven years. Let’s assume that a conservative forecast of free cash flow for the investment indicates a positive net present value and an IRR that is 1.6 times the weighted average cost of capital. Finance theory suggests that this investment would add nicely to the market value of the company.
Under EVA, the cost of owning an asset is the sum of the depreciation and capital charge, which is highest in the first year and then declines as the asset depreciates away. This investment project contributes negative EVA for three years, slightly positive EVA in years four and five, and sharply rising EVA in years six and seven after the asset is fully depreciated—and is essentially free. If we had a seven-year-old asset being held together by rubber bands and shoelaces, we probably would want to replace it. But it would sure hurt to see all that EVA disappear, replaced by negative EVA that takes four years to turn positive again. So the natural response of many managers is to defer that replacement decision as long as possible, because that’s what EVA is paying them to do. If they overcome this incentive to sweat old assets, they do so by putting the interests of the company ahead of their own (bonuses).
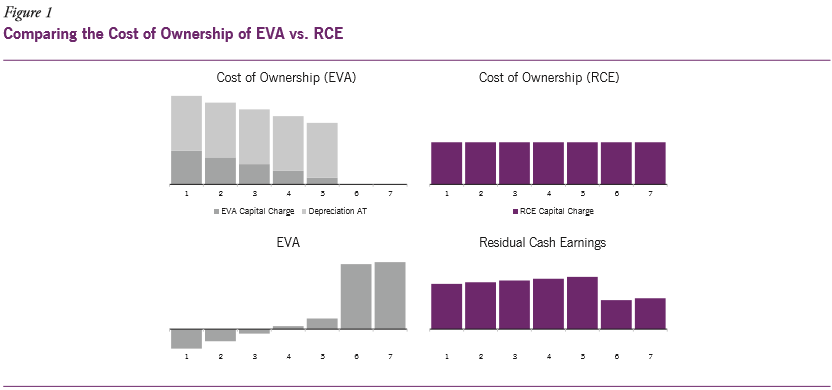
It’s easy to illustrate how a focus on continuously improving EVA can stifle investment. The two graphs on the left side of Figure 1 illustrate the total cost of depreciation plus the capital charge (the top graph) and the EVA for this investment (the bottom graph).
The biggest difference between RCE and EVA is that RCE doesn’t charge for depreciation—and because the capital charge is based on gross assets, it doesn’t decline over time. As can be seen in the two graphs on the right side of Figure 1, the cost of ownership is lower at the outset but stays flat even after the asset is fully depreciated. As a result RCE is positive out of the gate and actually declines a bit in years six and seven when taxes rise (as the tax-deductible depreciation runs out).
With RCE, there is more incentive to replace old assets, while maintaining strong accountability for earning a return over time (RCE in years six and seven is actually much lower than EVA, which by then treats capital as essentially free, with the asset base having been depreciated away).
In addition to the predisposition to avoid replacing old assets, the same early negative EVA stands in the way of making new growth investments, such as capacity or geographic expansions. Even R&D investments work the same way, since although both EVA and RCE capitalize R&D, the EVA model amortizes the R&D, thereby frontloading the costs in the same way it does for capital expenditures. Because the RCE model does not amortize R&D, the cost of ownership, which is just the capital charge, remains flat—as it does in the case of capital expenditures—with less charge up front and no upward drift in performance as capitalized R&D amortizes away.
Acquisitions are a special kind of investment, since companies typically pay a premium on top of the stand-alone enterprise value of the acquired company, which can lead to not only more tangible assets, but also goodwill and other intangibles, on the books. In the case of one client that had evaluated the performance of its businesses using the spread between return on invested capital (ROIC) and the cost of capital—which is essentially EVA as a percentage of capital— we were asked to compare their acquisition analysis to an RCE-based analysis for two deals. Where their analysis showed ROIC not exceeding the cost of capital until years four and five for the two deals, respectively, our RCE analysis showed the same deals turning positive in years one and two. And in the late years of the company analysis, ROIC was over 50% with the assets mostly depreciated, while RCE was close to flat with a small upward drift.
This is not to say we want management to be excited about any old acquisition that comes along; but for clearly good deals, we’d like the measurement and incentive system to reward them sooner if they deliver decent cash returns. Just as in the case of organic investments, RCE provides more incentive to invest in the deal and more accountability for actually delivering a return over time.
Under EVA, then, acquisitions, R&D and other growth investments, and even asset replacements, all face similar short-term headwinds. RCE undoes these accounting effects in a way that encourages value-creating investments—while at the same time maintaining accountability for delivering adequate returns over the full life of the investment. None of this is meant to deny that the net present value of EVA gives companies the right signals about value creation. But because the distribution of EVA by year typically shows a sharp downturn when an asset is new, and the benefits appear in later years, managers in EVA-driven companies are encouraged to emphasize the short term. RCE, by contrast, spreads the benefits out more evenly over time. With these differences between RCE and EVA, it is easy to see that a management framework focused on improvements in RCE for the overall business is likely to encourage a healthier balance in management’s focus as it makes tradeoffs between growth and return, and between current and future performance.
Despite these drawbacks of EVA, there are companies that have been using EVA for decades, some quite successfully. The best example may well be a metal packaging manufacturing company called Ball Corporation, which began using EVA decades ago. From the end of 1999 through mid-2019, a dollar invested in Ball would be worth almost 12 times as much as a dollar invested in the S&P 500. They have invested heavily, both organically and through acquisitions. And since they have grown rapidly while also producing high returns on capital, the Ball management team shows no signs of succumbing to the common tendency of EVA-driven companies to underinvest.
Scott Morrison, CFO, attributes Ball’s success with EVA to the following:
… [K]eeping EVA simple and making sure everyone understands it. We challenge ourselves and our whole management team to not just drive efficiencies, but to always be looking for investments that help us grow. The status quo isn’t what we are after, we are always looking for investments that will grow our EVA dollars. We are quite willing to give up some EVA in the short run, at times, in order to drive longer-term EVA improvement.
The case of Ball shows that it’s entirely possible for companies to embrace EVA and still invest in growth. But as the CFO’s comments suggest, it is likely to require creating and reinforcing a culture that overcomes the natural tendencies of managers to limit investment when faced with such measures and incentive constructs.
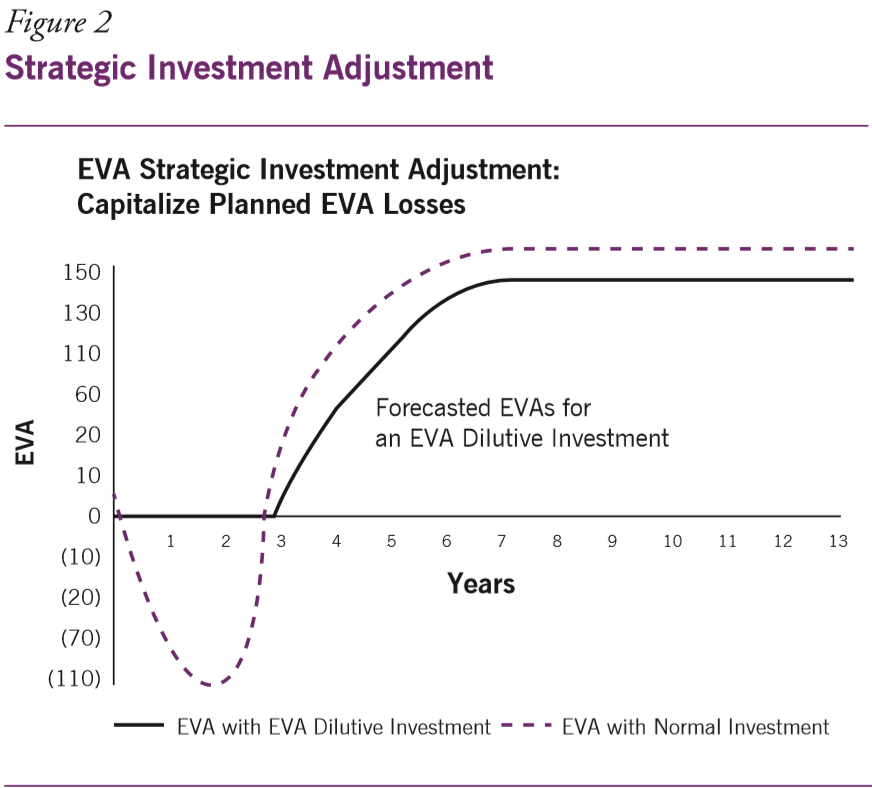
Moreover, when so many companies declined to pursue such value-creating investments, Stern Stewart responded by developing a new EVA adjustment, known as the “strategic investment adjustment.” The most common approach was to forecast the projected EVA for a large investment, such as an acquisition. And when the early planned EVA was negative (which was most of the time), the expected negative EVA was capitalized and treated as part of the investment. This provided the chance to reflect positive EVA, normalize rewards, and encourage managers to approve such investments in a way that EVA, without such an adjustment, would not. And since it was the planned negative EVA that was capitalized, if the result turned out to be worse than planned, the variance would still drag EVA down. (To illustrate this technique, Figure 2 shows a generic version of a slide from a client presentation to investors from the 1990s.)
Though the strategic investment adjustment sought to smooth the EVA in the early years, and thus reduce or eliminate any disincentive to invest, it added computational complexity that many managers found hard to process. And especially for those managers that were not with the business when the investment was made, it was hard to accept all the strategic investment capital in year seven that was not on the balance sheet. What could they do to improve the productivity of that capital? So, to avoid adding too much complexity, most companies instituted thresholds that ensured they would use this approach for only very large (strategic) investments. And so the bias against small growth investments remained. But worst of all, this strategic investment adjustment introduced a new element of negotiation, and thus yet another opportunity for the gaming of performance targets. Since the plan and financial forecast for the investment that was shown to the board for approval was now also used for adjusting the performance measure, management had an incentive to make the early years of the forecast seem even worse than they expected to build a cushion into the targets. They could always boost the out-years projection to protect the NPV analysis to ensure the investment would still be approved. It’s easy to see how this gaming could be counterproductive—and so a better solution was needed.
RCE Relates Better to TSR
When considering a performance measure, the primary objective is to ensure that the behavior being motivated when managers seek to improve the measure is consistent with increasing the long-run value (or in finance terms, the NPV) of the organization. In addition to testing how the measure responds to investments and other actions, as discussed above, it is important to know that there is strong alignment with total shareholder return (TSR), which measures dividends and share price appreciation in relation to the starting share price.
Why TSR? Why not try to explain a valuation multiple instead? Investors seek to increase the value of their investment and it doesn’t matter if they own stocks with high or low valuations; all that matters is how much the value of their investment grows, and it is TSR that provides the best indicator of this growth. In fact, our research at Fortuna Advisors shows that companies with higher average valuation multiples tend to have lower TSR.9 So, we absolutely don’t want to maximize valuation at any given point in time—our aim is to improve value over time, while also accounting for dividends along the way.
When testing RCE’s relationship with TSR, we began by denoting the change in RCE as ∆RCE; and to allow for comparisons among large and small companies over time, we measured the ∆RCE over a three-year period as a percentage of the Gross Operating Assets at the start of the three-year period. And to provide a rough control for differences in company characteristics and industry dynamics, we then sorted companies into 20 different industries10 to be able to calculate the industry-adjusted median TSR of companies that delivered above-median ∆RCE to those that performed below the median level.
To evaluate the key differences between RCE and EVA, we constructed an EVA-like economic profit (EP) measure based on RCE, but with depreciation and R&D amortization charged to NOPAT, and with accumulated depreciation and R&D amortization netted against capital. By isolating these differences, this approach made sure the comparison was directly aimed at whether our treatment of depreciation and R&D amortization does or does not improve the relationship between ∆RCE and TSR.
In each of the 20 industries, we found that separating companies based on ∆RCE provided a stronger TSR indication than separating companies based on ∆EP. Consider the case of Media and Entertainment, which is the industry where ∆RCE showed the biggest advantage over ∆EP. For each three-year cycle, we first separated companies into those above and below median on ∆RCE as a percentage of beginning Gross Operating Assets. Then we aggregated all the companies from all three-year cycles and measured the median TSR for each group.
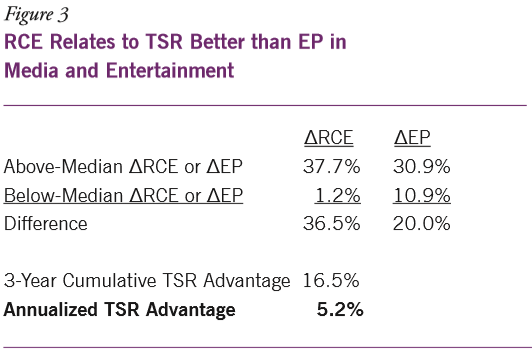
The median three-year TSR for the high-∆RCE media companies was 37.7%; for those with below-median ∆RCE, it was 1.2%, providing a difference of 36.5%. When we replicated this using ∆EP in place of ∆RCE, the high-∆EP media companies had median three-year TSR of 30.9% versus 10.9% for the low-∆EP group, for a difference of 20.0%. Thus, the TSR advantage of high- versus low-∆RCE companies, as shown in Figure 3, was 16.5% higher than that for the ∆EP companies over the three-year period, or 5.2% higher on an annualized basis.
Some companies that make significant value-creating investments in the future will see their EP decline in the near term for reasons discussed earlier, moving them into the below-median ∆EP group. But if investors have confidence in those investments, their TSR is likely to remain high. And to the extent the market “looks past” the low EVA, the difference between the median TSRs of the high- and low-∆EP groups tends to be smaller than in the case of the ∆RCE groups, reducing the explanatory power of EP relative to RCE. As shown in Figure 4, this RCE advantage can be seen in all of the industries we looked at.
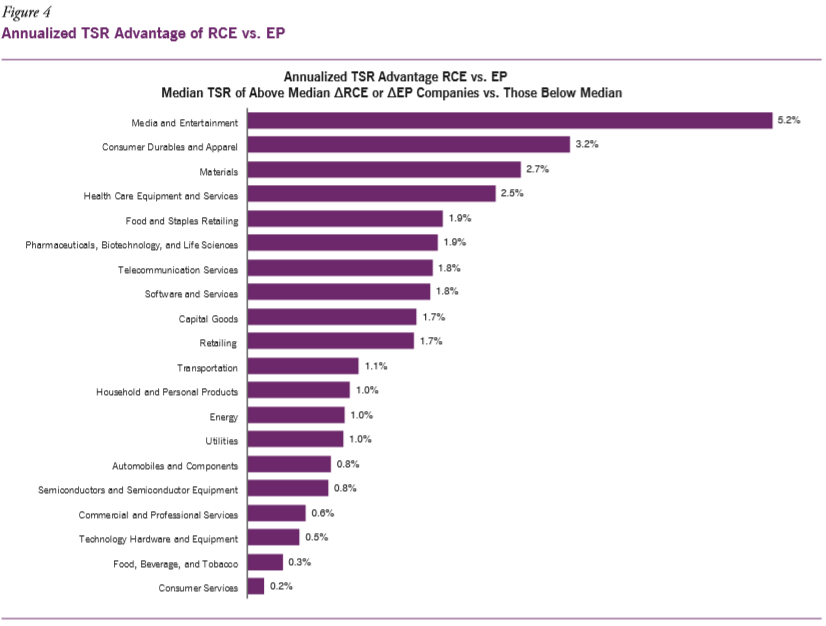
These findings suggest that RCE is a more reliable proxy for value creation than EP (or EVA), and that one should feel confident that if management devotes its efforts to growing RCE, high TSR should follow.
RCE Spotlight: Stop Seeing Amazon as Unprofitable
In the modern world, where growth in many industries is increasingly driven by investment in intangibles and R&D (as opposed to tangible, fixed assets), RCE is designed to reflect value creation in this environment. As a testament to this possibility, in 2017 the Fortuna team and I published an article in the Journal of Applied Corporate Finance on the valuation of high-tech companies that showed how RCE could be used to explain, among other things, the remarkable valuation of Amazon, then about $1,200 a share.11 Here we have taken this analysis a step further to show how well RCE explains the 50% increase in Amazon’s share price since then.
Using first EVA (based on the EP methodology discussed above) and then RCE, we estimated the value of Amazon shares over the entire ten-year period ending in 2018 by assuming that its current performance continues forever, thus providing investors with what amounts to a perpetuity of its most recent year’s results. In the EVA literature, this calculation is referred to as a company’s “current operations value” (or COV). Any difference between a company’s current enterprise value and its COV is known as its “future growth value” (or FGV). FGV, at least in theory, also represents the NPV of expected increases in EVA.
Figure 5 Amazon’s RCE-implied Share Price vs. EVA-Implied Share Price
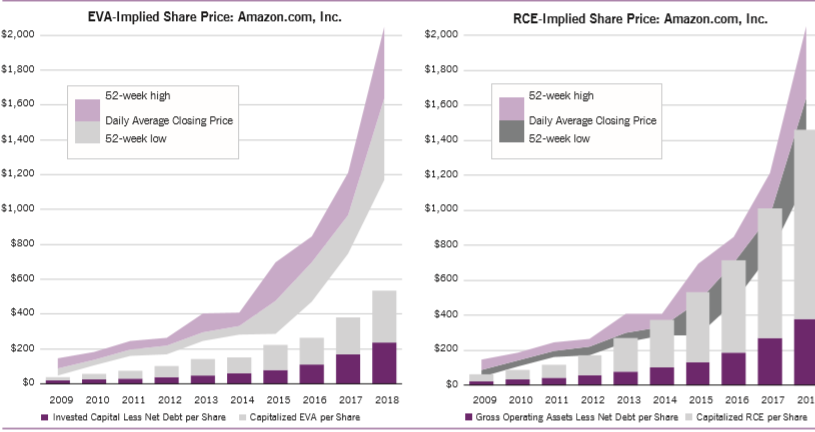
The findings of our analysis are shown in Figure 5, which shows Amazon’s 52-week high, low, and average daily closing prices for each of the ten years. In the graph on the left side of the figure, the lower stacked bar reflects the book value of the capital invested in Amazon, reduced by net debt, on a per share basis. The upper bar reflects the per share value of Amazon’s EVA divided by the weighted average cost of capital, which is the present value of flat EVA in perpetuity. The right graph is similar, except the lower bar reflects the per share value of Gross Operating Assets less net debt and the upper bar reflects capitalized perpetual RCE per share.
During the 2009-2012 period, both valuations seem low, with meaningful growth assumptions—and hence large FGVs—baked into the share price.12 But from 2013 through 2018, the measures give very different valuation impressions. On average, the RCE-implied valuation during this period is within 1% of the actual daily average closing price, while the EVA-implied share price sits at a 58% average discount. Amazon has been heavily investing in building an airline and a network of warehouses with trucks and other equipment; and the huge depreciation associated with this investment, along with the amortization of capitalized R&D, has constrained the growth in EVA, but not RCE. From 2012-2018, our estimates show that Amazon’s RCE increased by over $38 billion while EVA improved by less than $11 billion (see the Appendix for the calculations).
This is an interesting case study that demonstrates the explanatory power of RCE versus EVA in new economy companies, and the implications are huge. There are many large traditional retailers that have attempted to compete with Amazon but few have succeeded in any meaningful way. This illustration raises the possibility that traditional financial metrics have discouraged Amazon-like investments and strategies. If Walmart, Home Depot, Best Buy, Macy’s, and others had been using RCE to develop business plans, evaluate investments, and measure performance for bonuses, would Amazon now have more successful competitors?
RCE Case Study: Varian Medical Systems
For over 70 years, Varian Medical Systems has helped lead the fight against cancer by innovating cancer therapies, and the company is currently the market leader in radiation therapy.13 The number one priority of Varian management is to find new and better ways to increase access to cancer care for more patients across the globe.
Historically, Varian’s competitive advantage has derived from a culture of innovation premised on and supported by significant R&D investment. But after a long run of innovation that both extended Varian’s therapeutic reach and resulted in strong growth through the mid-2010s, the company’s TSR began to sag. On closer inspection, the main reason for the stagnating share price was a slowdown in the company’s release of new, innovative products to drive the market—and this meant that the company’s capacity to reach patients was being undermined.
As management dug deeper into the company’s investment decision-making and compensation processes, it became clear that some of these processes were subtly, and inadvertently, reducing management’s motivation to invest in critical R&D and innovation. As the centerpiece of a new way of thinking and running the business, Varian’s management decided in 2017 to adopt a customized measure known internally as “VVA,” or Varian Value Added, which is a customized version of RCE. One of the most important benefits of VVA over traditional economic profit is that it treats expenditures in R&D as investments rather than period expenses, as in standard GAAP procedures.
As Gary Bischoping, Varian’s CFO, said about the company’s new performance evaluation framework,
This removes any incentive to cut R&D to meet a short-term goal, so it promotes investing in innovation. At the same time, since there is enduring accountability for delivering an adequate return on R&D investments for eight years, there is more incentive to reallocate R&D spending away from projects that are failing and toward those that project the most promising outcomes—for patients and shareholders.
In parallel with the launch of new incentive designs, the company embarked on several layers of communication and training.
In the next step, Fortuna and Varian collaborated to understand the investor expectations that were baked into the share price and to estimate the amount of VVA improvement required to expect to deliver a top-quartile TSR among peers. This estimate in turn provided a basis for estimating how much investment was needed over time. Since one of the most common causes of growth shortfalls is underinvestment, this goal-setting process was designed to determine at the outset how much investment would be required to achieve the company’s goals. This exercise led management to think of investments in a different and more productive way.
Planning has evolved at Varian as well, and is now designed to balance short- and long-term goals using parallel “run-the-business” and “change-the-business” frameworks that allocate resources to the most productive users and uses of capital. Whether growing current business lines or funding innovation for future products and services, the process seeks to find the best value-creation opportunities and dedicate more resources to these areas. The planning and budgeting processes have benefited from how VVA integrates the P&L with the balance sheet, and from the reinforcement of incentives that are no longer tied to budgeted goals.
Every major investment, including capital expenditures, R&D, and potential acquisitions, is now evaluated using VVA. Although the NPV of VVA is similar to NPV based on free cash flow, the benefit comes from the way the methodology ties directly to how management will be measured after the investment. The company evaluates NPV as a percentage of the investment, which is referred to as the “VVA profitability index” and can be compared to “margin of safety” hurdles. This approach provides a more reliable way to prioritize investment opportunities than using internal rate of return (IRR), which has a number of problems.14
This case study shows how a customized version of economic profit, derived from RCE, can be used to drive planning and motivate better investment decision-making. In the case of Varian, VVA helped clarify which businesses, markets, and acquisitions could create the most value, and even led the company to shift capital from its buyback program to more promising long-term investments.
Conclusion
As many readers will be aware, this issue of the Journal of Applied Corporate Finance follows the recent passing of Joel Stern, co-founder (with Bennett Stewart) of Stern Stewart and co-inventor of EVA. In this sense, this issue is a tribute to, and celebration of, Joel’s life and his enduring contributions to the study and practice of corporate finance. I am deeply grateful for the opportunity to have worked with and learned from Joel for so many years, and equally grateful for the opportunity to participate in this memorial to his life’s work.
EVA was a game changer in the field of performance measurement—no question about it. It was the first measure to successfully combine aspects of both quantity (think EBITDA) and quality (return on capital) into one comprehensive, reliable measure of value creation. Yet for all of its benefits, EVA’s success was limited by its drawbacks: too much complexity, along with the pressure to underinvest exerted by its frontloading of investment costs.
We at Fortuna Advisors are proud to carry the torch in pursuit of better performance measurement and more value creation—not just for shareholders, but for all stakeholders and society at large. None of this would have been possible without Joel’s contributions to this effort. Thank you, Joel.
GREG MILANO is the Founder and Chief Executive Officer of Fortuna Advisors, an innovative strategy consulting firm that helps clients deliver superior Total Shareholder Returns (TSR) through better strategic resource allocation and by creating an ownership culture. He is the author of the forthcoming book, Curing Corporate Short-Termism. Previously, Greg was a partner of Stern Stewart, where he founded Stern Stewart Europe and then became president of Stern Stewart North America.
Endnotes:
1. EVA is a registered service mark of Stern Value Management, Ltd. (originally by Stern Stewart & Co. in 1994) for financial management and consulting services in the area of business valuation, and is registered as a trademark by Institutional Shareholder Services Inc. (originally by EVA Dimensions LLC in 2008) for a number of uses.
2. Karame, Marwaan, “Prepare for This Pay-for-Performance Measure,” CFO.com, December 4, 2018. http://fortuna-advisors.com/2018/12/04/prepare-for-this-pay-forperformance-measure/.
3. Joel M. Stern and John S. Shiely, The EVA Challenge: Implementing ValueAdded Change in an Organization (New York: Wiley, 2004). 4 Milano, Gregory V., “EVA and Growth,” EVAngelist, Volume IV, Issue IV, Italy 2000, pages 9-13.
4. Milano, Gregory V., “EVA and Growth,” EVAngelist, Volume IV, Issue IV, Italy 2000, pages 9-13.
5. HOLT® is a registered trademark of Credit Suisse Group AG or its affiliates in the United States and other countries. 6 Milano, Gregory V., “Postmodern Corporate Finance,” Journal of Applied Corporate Finance 22, no. 2 (Spring 2010): 48-59.
6. Milano, Gregory V., “Postmodern Corporate Finance,” Journal of Applied Corporate Finance 22, no. 2 (Spring 2010): 48-59.
7. Wikipedia contributors, “Economic value added,” Wikipedia, The Free Encyclopedia. Accessed August 21, 2019. https://en.wikipedia.org/wiki/Economic_value_added. A list of common adjustments to EVA includes: (1) eliminating excess cash and the NOPAT impact; (2) adjusting NOPAT for the change in provision for bad debts; (3) converting LIFO inventory to FIFO; (4) removing all pension charges from NOPAT except the annual service cost, and treating underfunded pensions as debt (and vice versa); (5) capitalizing the present value of operating lease commitments and removing the financing portion of leases from NOPAT; (6) capitalizing and amortizing R&D and certain marketing expenditures; (7) removing unrealized gains/losses on hedging-related derivatives; (8) removing minority interest effects; (9) permanently capitalizing (and removing from NOPAT) unusual items including: a) impairment charges and asset write-offs, b) restructuring and nonrecurring items, and c) gains and losses on sale of assets; and (10) charging an adjusted cash tax amount by: a) applying a standard tax rate, b) adjusting for deferred taxes, and c) recognizing the tax benefit from deducting stock options.
8. Milano, Gregory V., “Be Cautious About Sweating Your Assets,” CFO.com, October 16, 2017.
9. Milano, Gregory V., “Is a Higher Valuation Multiple Always Better?” CFO.com, July 27, 2017. http://fortuna-advisors.com/2017/07/27/is-a-higher-valuation-multiple-alwaysbetter/.
10. The study was based on the current members of the Russell 3000, excluding the financial, insurance, and real estate industries (where RCE would need to be refined). The data set is based on annual data going back to 1999 and companies were included over rolling three-year periods when there was full financial and TSR data for the full three-year period. The data from all periods was combined to show the relationship on average through all aspects of the business cycle.
11. Milano, Gregory V., Arshia Chatterjee, and David Fedigan, “Drivers of Shareholder Returns in Tech Industries (or How to Make Sense of Amazon’s Market Value),” Journal of Applied Corporate Finance 28, no. 3 (2016): 48-55.
12. From 2009 through 2012, the EVA-implied value represented an average discount of 58% and the same statistic was 32% for RCE, so even during this period, the differences in value were large.
13. This case study is based on the article “How One Company Balanced Current Performance with Investing in the Future,” published by FEI Daily. Milano, Gregory V. and Gary E. Bischoping, Jr., “How One Company Balanced Current Performance with Investing in the Future,” FEI Daily. June 26, 2019. https://fortunaadvisors.com/2019/06/26/how-one-company-balanced-current-performance-with-investing-in-the-future/.
14. The typical approach to prioritizing investments is to use the internal rate of return, or IRR; but four major flaws affect this approach. The first is that if a project has cash flows that flip direction more than once, there will be multiple IRR solutions. Which one do you use? The second flaw is that projects with different durations can have the same IRR and yet very different net present values, which can lead to poor prioritizations and underperformance. Third, IRR also assumes that cash inflows are reinvested at the IRR, while NPV doesn’t. Finally, IRR doesn’t indicate the dollars of value creation, whereas NPV does. This is important when thinking about prioritization under constraints, such as a limited number of managers or a fixed capital budget, because only NPV can be used to find value optimization.
Appendix: RCE vs. EVA Calculations for Amazon
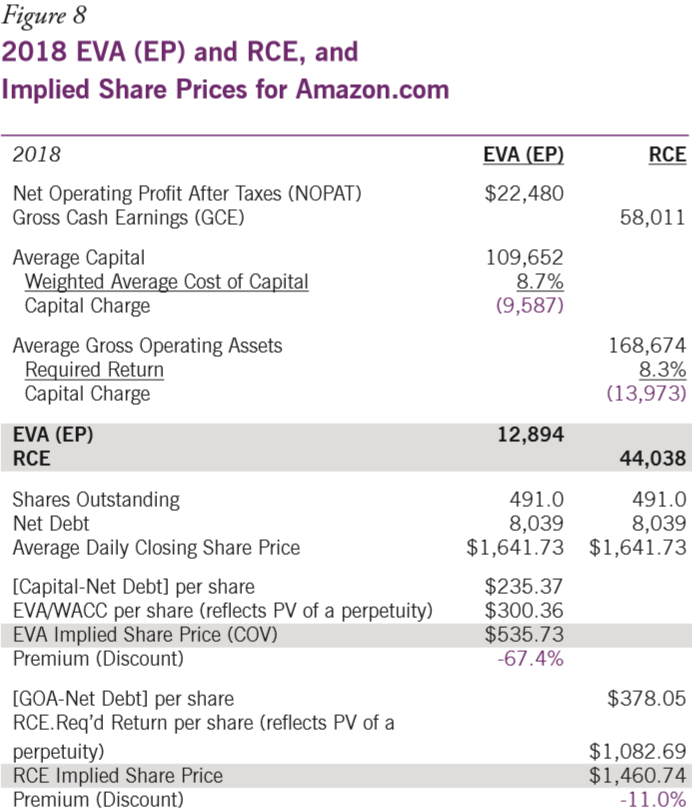
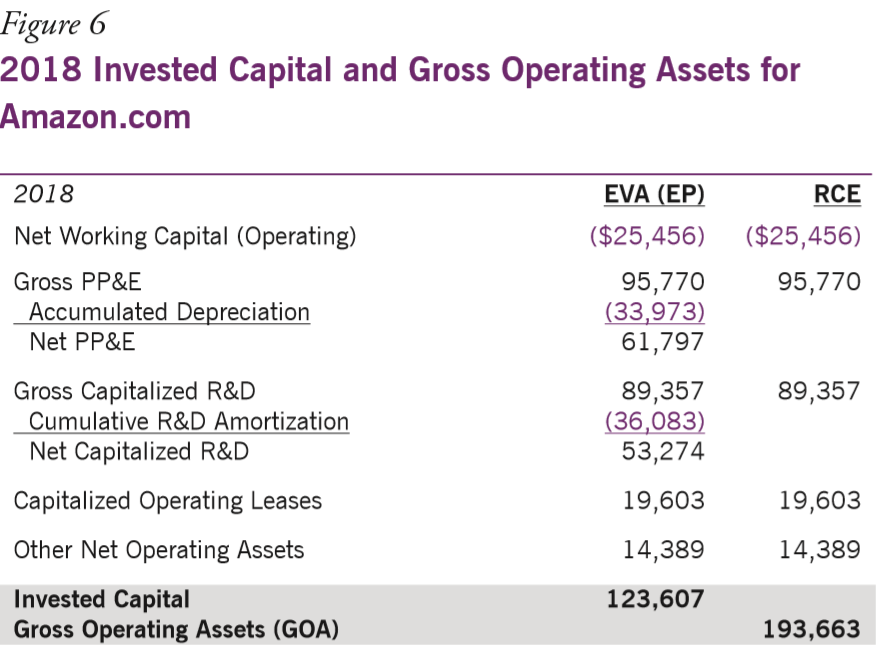
It is perhaps easiest to understand the differences between RCE and EVA by viewing the calculations, so the following explains the 2018 RCE and EVA calculations for Amazon. com. As in the body of the article, the simplified Economic Profit (EP) calculation is used as a proxy for EVA. The first step is to calculate Capital and Gross Operating Assets, shown in Figure 6. Whereas invested capital, as used in the calculation of EVA, includes PP&E net of depreciation and net capitalized R&D, with the cumulative R&D amortization subtracted, the Gross Operating Assets used when calculating RCE is based on gross PP&E and Gross Capitalized R&D. Note that both measures include capitalized leases based on the present value of the reported minimum lease commitments.
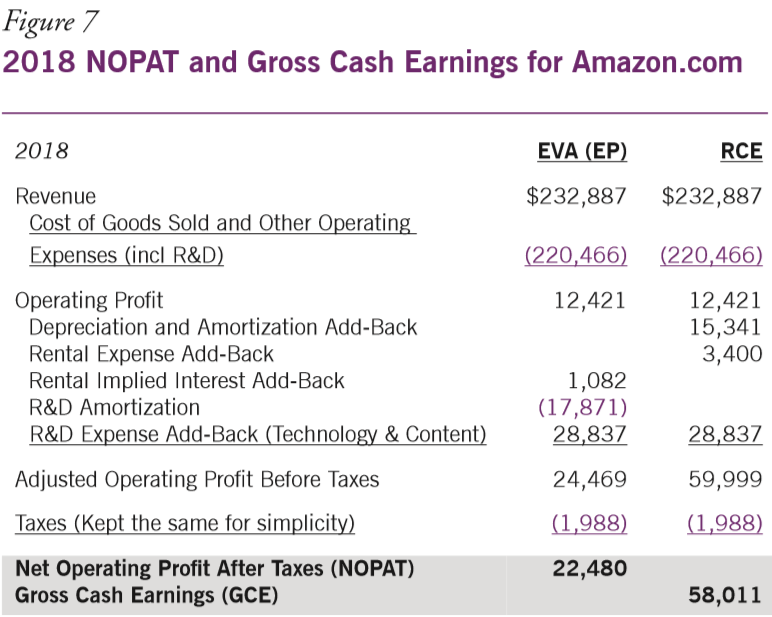
The second step is to calculate the two measures of income: Net Operating Profit after Taxes (NOPAT) for the EVA calculation, and Gross Cash Earnings for RCE, which is shown in Figure 7. One of the two major differences between the two measures is that depreciation and R&D amortization are charged to NOPAT, while neither is charged to Gross Cash Earnings. The other difference relates to the treatment of leases, with EVA adding back the implied interest based on the amount capitalized, while RCE has the full rent added back to be consistent with excluding all depreciation. We combine these findings to determine EVA (EP) and RCE, and we then use these estimates of EVA and RCE to determine the implied share price based on a perpetuity valuation. As shown in Figure 8, we determine the capital charge in each case by multiplying the average of the beginning and ending balance of capital or Gross Operating Assets by the WACC or Required Return, and this is subtracted from the NOPAT or Gross Cash Earnings. As can be seen, the amount of RCE is over three times that of EVA, and this difference is large because Amazon has generally new assets and the differences are quite material.
The second step is to calculate the two measures of income: Net Operating Profit after Taxes (NOPAT) for the EVA calculation, and Gross Cash Earnings for RCE, which is shown in Figure 7. One of the two major differences between the two measures is that depreciation and R&D amortization are charged to NOPAT, while neither is charged to Gross Cash Earnings. The other difference relates to the treatment of leases, with EVA adding back the implied interest based on the amount capitalized, while RCE has the full rent added back to be consistent with excluding all depreciation.
We combine these findings to determine EVA (EP) and RCE, and we then use these estimates of EVA and RCE to determine the implied share price based on a perpetuity valuation. As shown in Figure 8, we determine the capital charge in each case by multiplying the average of the beginning and ending balance of capital or Gross Operating Assets by the WACC or Required Return, and this is subtracted from the NOPAT or Gross Cash Earnings. As can be seen, the amount of RCE is over three times that of EVA, and this difference is large because Amazon has generally new assets and the differences are quite material.
Finally, we estimate the implied share prices by subtracting net debt from capital and Gross Operating Assets, on a per share basis. We then determine a premium above this by capitalizing the EVA and RCE on a per share basis, and this is where the real value shows up for Amazon.com. The EVA (EP)-implied share price only reflects one-third of Amazon’s share price, indicating an enormous future growth value (FGV), especially for a company that already has $233 billion in revenue—how big are they expected to get? RCE implies a more modest FGV of 11% of the valuation.