
Outsized market performance yields plenty of benefits for publicly traded companies. It typically leads to higher incentive compensation and signals investor confidence in management. For the treasury function, it may also help them fund operations on advantageous terms or issue stock at favorable prices.
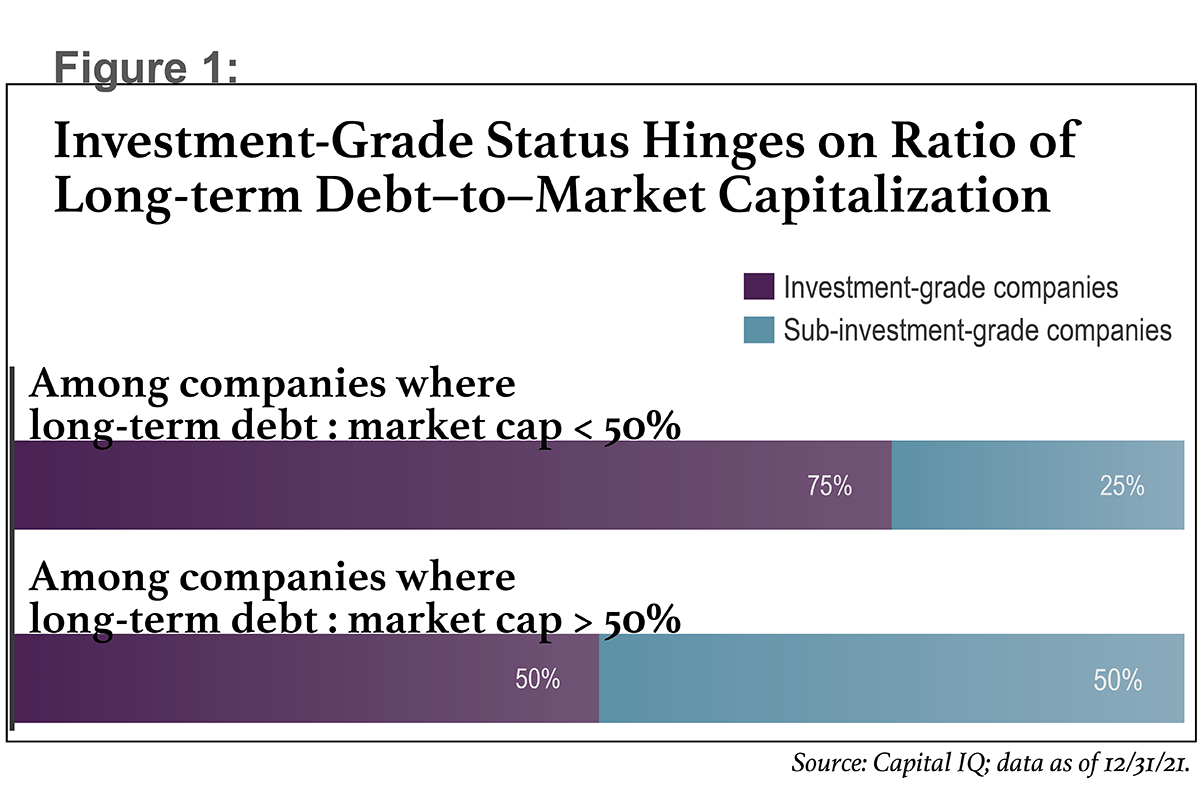
A higher market capitalization reduces a company’s debt-to-equity ratio, which increases the likelihood of achieving an investment-grade credit rating (see Figure 1). Higher share prices can also serve as a useful currency to fund strategic mergers and acquisitions (M&A), since companies can either exchange stock or issue shares for cash to fund a transaction.
So, understanding how businesses drive market value is crucial not just for the C-suite at large, but for treasury and finance professionals especially. Research published by Fortuna Advisors offers insights into some characteristics that help companies produce exceptional market returns.
Our study examined how different metrics influenced total shareholder returns (TSR) for the members of the Russell 1000 over the five-year period ending in 2020. Two metrics stood out at first glance: One is revenue growth. The other is reinvestment effectiveness, a measure we developed to quantify how well companies convert reinvestment into revenue. Essentially, reinvestment effectiveness can serve as a barometer of how well management teams invest their capital and understand where value creation opportunities exist.
Companies in the top quartile in either of these metrics were likely to also be in the top quartile in terms of TSR. (See Figure 3, below.) Still, our research proved that even these measures don’t always tell the whole story. And focusing on one or multiple individual, incomplete metrics can lead to adverse decision-making, dampening financial outcomes.
Instead, corporate treasury and finance teams should embrace economic profit measures that balance the tradeoffs between other common metrics. Indeed, when we added our own cash-based measure of economic profit, which we call “residual cash earnings,” to the analysis, it eclipsed all the other metrics as a driver of value creation.
Five-Tool Playbook for Value Creation
Most corporate management teams gauge their company’s performance using too many disparate key performance indicators (KPIs). Moreover, they don’t do enough to understand how those measures relate to one another or contribute to overall value creation.
Through extensive capital market research and collaboration with clients, Fortuna developed a shortlist of metrics that, together, reliably and comprehensively explain value creation. We refer to these metrics as the “five tools of value creation.” (See Figure 2.) Treasury and finance teams can view this combination of metrics as a playbook for understanding the impact of their financial strategies on TSR, and for communicating resulting actions to investors.
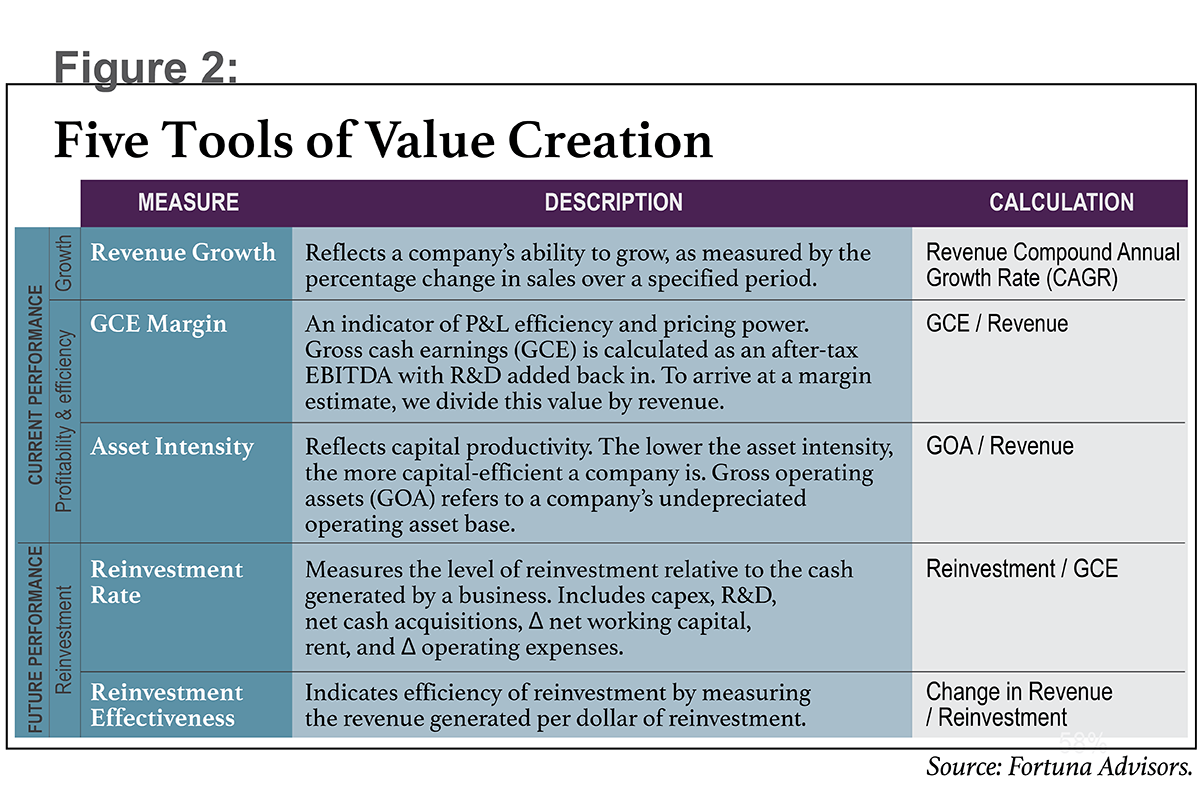
To measure growth, we use the five-year compound annual growth rate (CAGR) of the company’s revenue. For profitability, we use a measure we refer to as gross cash earnings (GCE) margin. Calculated by dividing gross cash earnings—i.e., profit—by revenue, GCE margin indicates P&L efficiency on a cash basis and typically capitalizes investments in value-creating research and development (R&D). Depending on a company’s business model, we may also capitalize inputs like marketing and rent expense. The third tool, asset intensity, relates to capital efficiency. With asset intensity, less is more (all else being equal)—that is, a low asset intensity indicates high capital productivity.
Our final two measures relate to investment and include the reinvestment rate—how much of its gross cash earnings a company reinvests—and reinvestment effectiveness, which tracks the revenue growth per dollar of investment.
Trends in Value Creation
To identify the characteristics of top performers, we measured TSR performance from 2016 through 2020 for the members of the Russell 1000 Index that do business in a sector outside financial services. We then divided the companies into quartiles for each of the five measures in our value creation toolkit.
Next, we calculated TSR quartile distribution across the companies in the study to understand the likelihood that an organization performing in the top quartile in one of the five toolkit measures would also land in the top quartile for total shareholder return.
Finally, for each metric, we calculated the increased likelihood that a company in the top quartile on the given measure would be in the top quartile for TSR, rather than the bottom quartile for TSR. This increased likelihood, represented by a multiple, enabled us to rank each measure’s contribution to TSR. See Figure 3.
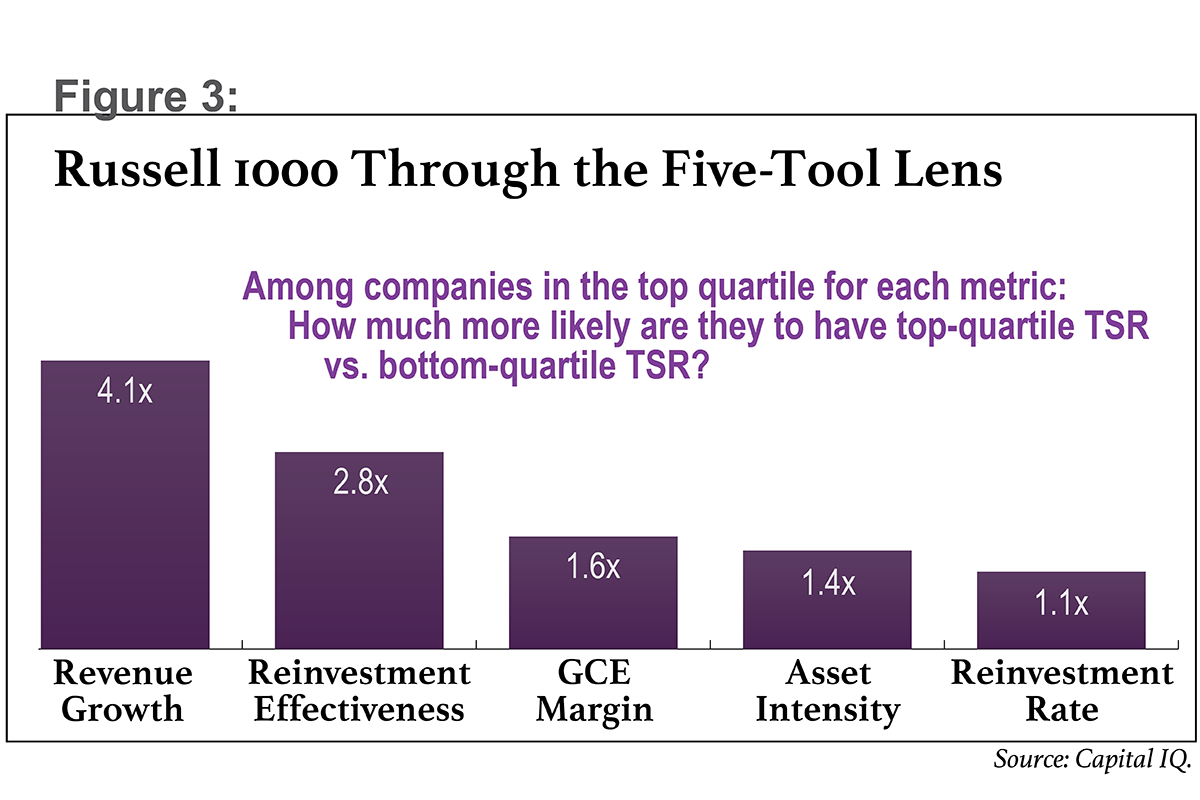
This analysis shows us that a company which achieved top-quartile revenue growth was more than four times more likely to have top-quartile TSR (55%) than bottom-quartile TSR (13%). We might infer, then, that a focus on revenue growth will more likely result in better TSR performance than, say, asset intensity or reinvestment rate.
Here’s how our five tools correlated to total shareholder return in this analysis:
Revenue growth. Unsurprisingly, revenue growth was the best indicator of a company’s TSR. Revenue growth is a perennial performer for investors, but its performance in our study may have also been buoyed by 2020, when forward-looking growth took center stage in capital markets and innovative companies like Tesla, Amazon, and Nvidia led the way to all-time highs across indices.
For great companies that are already reasonably profitable, revenue growth tends to be the best way to add value—and substantially helps make them great stocks as well. But for companies that have yet to show adequate profitability, investors tend to be less rewarding of growth for growth’s sake, since each dollar of incremental revenue yields less value. Investors clearly value revenue growth under the right conditions, but this metric alone is not a panacea for underperforming stocks.
Reinvestment effectiveness. Our reinvestment effectiveness measure came in second. We believe this was fueled in part by increasing rates of disruption and industry turnover, as well as the heightened need for management teams in large, diversified companies to continually assess where their best future returns exist across their portfolios and differentiate allocations accordingly. In other words, it speaks to the increased importance of strategic, and continued, resource allocation efforts by the C-suite.
Profitability (GCE margin). In third place was our measure of profitability. This ranking was a bit of a surprise, given investors’ historical affinity for profit measures like EBITDA. Apparently, it’s not enough to be large, profitable, and cost-efficient. Companies that want to reach top-quartile TSR need to chart a path to grow revenue over time.
Asset intensity. Fourth place went to asset intensity. We encourage taking this result with a bit more nuance than our other metrics, since results varied depending on profitability. In some cases—particularly among high-growth companies that were rapidly scaling investments in operations and innovation—high asset intensity (normally a bad thing) actually correlated to stronger market-value creation.
Reinvestment rate. Last was reinvestment rate—investing aggressively alone didn’t cut it for investors. Companies that want to be rewarded by the market should take a differentiated approach to the allocation of their resources. While this result is not shocking, many of today’s great companies could stand to take a harder look at where they concentrate their investments. For many, that may be the largest obstacle to also being a great stock.
Overcoming Obstacles to Value Creation
For many large, diversified companies, the biggest barrier to value creation is often a simple lack of visibility into the differentiated value opportunities that exist across different business lines, segments, geographies, etc. It’s hard work, but generating a reliable value map across the company’s entire portfolio can pay huge dividends by enabling a more strategic approach to capital allocations … which brings us to the next obstacle to value creation.
Inertia of allocations. The inertia of pre-existing allocations can significantly dampen growth and thus market performance. In one study by McKinsey & Company, one-third of business units within participating companies received virtually the same capex allocation in the study year as in the prior year. The same research demonstrated that this approach is a mistake: Businesses that were more active in their allocations (within the top third) achieved, on average, a 30 percent higher total return to shareholders than did those in the bottom third.
The reality is that market and industry turnover have reached a faster pace than ever before, and the pace is only accelerating. This leaves many large public companies at a disadvantage relative to nimbler corporate structures like private equity– and venture capital–backed organizations.
Nevertheless, companies that get capital allocations right may be rewarded with a massive return on investment (ROI), and strategic resource allocation processes tend to pay off in a big way for investors. We believe corporate investor relations (IR), treasury, and finance teams can use our reinvestment effectiveness measure to help investors and executives determine how efficiently the organization is allocating its resources.
Too narrow a focus in measuring value creation. Although we’ve highlighted that revenue growth and reinvestment effectiveness had the largest influence on TSR over the past five years, we also believe it would be a mistake to focus on any individual metrics that aren’t comprehensive indicators of value creation. For example, revenue growth tells only part of a company’s story of shareholder value, as it doesn’t indicate how much capital was needed to achieve the growth. On the other end, return on invested capital (ROIC) tells a company how efficient its operations are at converting capital to profit, but it doesn’t speak to overall growth or the magnitude of that profit. Managing a business with the narrow goal of maximizing either of these measures in isolation would invite gaming of the system and would, inevitably, lead to suboptimal value creation—especially for large, diversified public companies.
For this reason, we believe management teams should focus more on cash-based economic profit measures, which are becoming increasingly popular with proxy advisory firms and investors due to their ability to balance growth, returns, and virtually all other value-driving metrics. In other words, economic profit measures are much better proxies for value creation than are the measures currently tied to incentives at most public companies.
After extensive work with economic value added (EVA), currently the most well-known economic profit measure, Fortuna’s team developed a new version of economic profit that we call residual cash earnings (RCE). This metric is simpler for management teams to use than EVA, and it doesn’t discourage investment due to its nuanced treatment of depreciation (which invites “sweating of assets”). In addition, Fortuna’s research has shown that change in RCE correlates more closely with TSR than does EVA, across every single industry.
One might also expect that relatively better performance for economic profit measures like RCE would be a distinguishing trait of companies with top-quartile TSR. To test this hypothesis, we re-ran our quartile analysis from the past five years, but this time we included change in RCE as a sixth metric (see Figure 4). The results show that—in terms of correlation of top-quartile performance on the individual metric with top-quartile return to shareholders, vs. bottom-quartile TSR—RCE growth dwarfs all five of the individual metrics that we identified as tools of value creation.
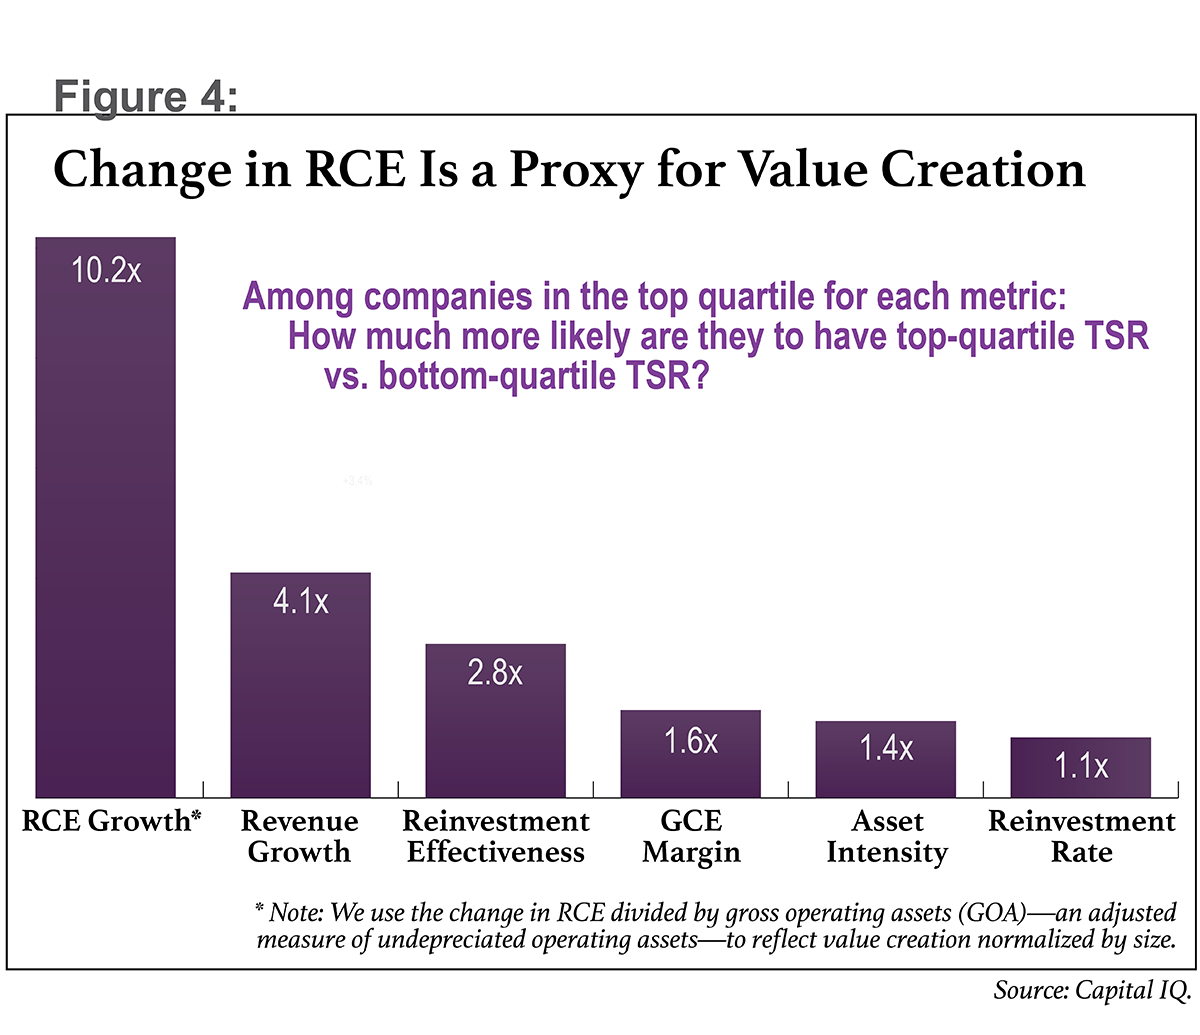
Companies that achieved top-quartile RCE growth had a 61 percent likelihood of having top-quartile TSR, versus a 6 percent likelihood of having bottom-quartile TSR. This is intuitive, since RCE is effectively a composite of the five tools. It also suggests that comprehensive measures like RCE can help investors and management teams better evaluate company performance.
Cash Flow Benefits of Managing by RCE
Free cash flow is the lifeblood of treasury and finance operations. It’s the nearly universally accepted basis for valuing businesses and their components, using net present value (NPV) analyses. And, indeed, cash generated by operations facilitates financing of operations. So the more free cash flow a business generates, the better able the treasury team will be to execute their functions.
Despite this, managing free cash flow on a period-by-period basis comes with a substantial drawback: It tends to stifle long-term investment. This isn’t particularly surprising if you think about the motivations involved in maximizing free cash flow in a given period. If maximizing the next quarter’s free cash flow is always the goal, managers are incentivized to cut long-term investment in order to reduce outgoing cash flows. Of course, the eventual effect of such cuts is a long-term drawdown in free cash flow, leaving companies at lower valuations and giving treasury teams less financing capacity and flexibility.
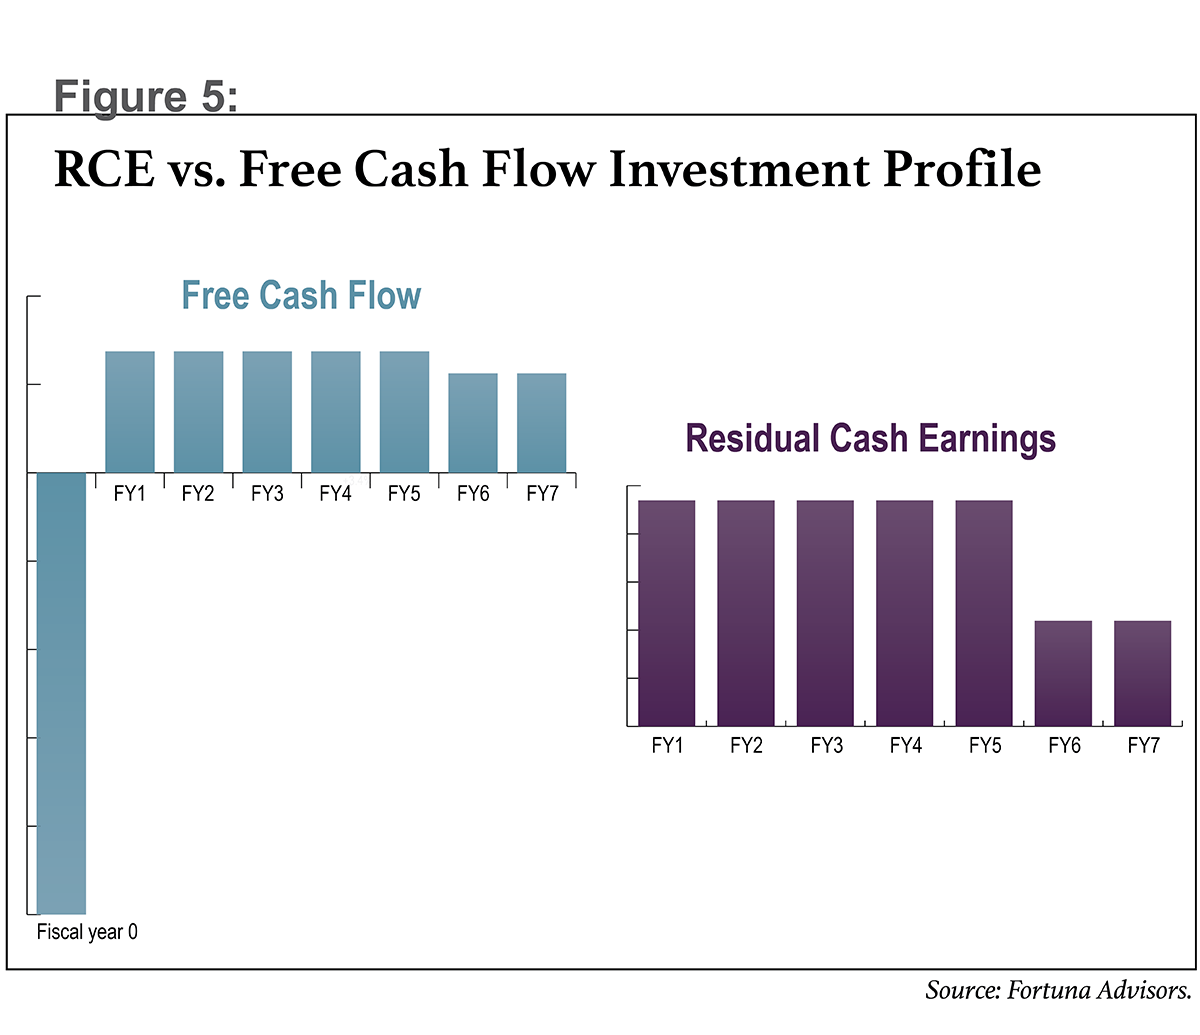
RCE was designed specifically as cash flow–based metric, so it also serves as a powerful valuation tool. But it differs from free cash flow in a few ways. Namely, it recognizes the benefits of capex sooner by spreading capital costs evenly across the life of an investment. With free cash flow, initial investment costs are incurred predominantly in the first period, making performance look inconsistent through the life of the project. On the other hand, RCE smooths out costs over the life of the project, providing a much more accurate account of value added in each performance period.
Figure 5 shows the same investment profile from a free cash flow versus an RCE perspective. While both measures will show the same NPV in aggregate, the way that RCE captures value creation on a period-by-period basis results in more willingness to invest in profitable long-term ventures.
By charging for the level of capital needed to produce cash returns, RCE also weighs the opportunity costs of not using capital efficiently. This means managers are going to be more concerned with how to best allocate their resources.
In addition, RCE calls for capitalizing key value drivers—which other measures tend to expense in a single period—across the useful life of investments. This may vary by business model, but often includes R&D, marketing, and rent costs. When such inputs are not capitalized, this can similarly cause managers to avoid value-additive long-term investments in favor of maximizing short-term profits.
Managing by RCE retains the valuation benefits of a cash flow–based measure, but instead creates a much stronger and healthier motivation to pursue future investment in the business. And all of this is balanced by imposing a capital charge, which ensures strong accountability on investment decisions.
RCE Relates to Better Solvency
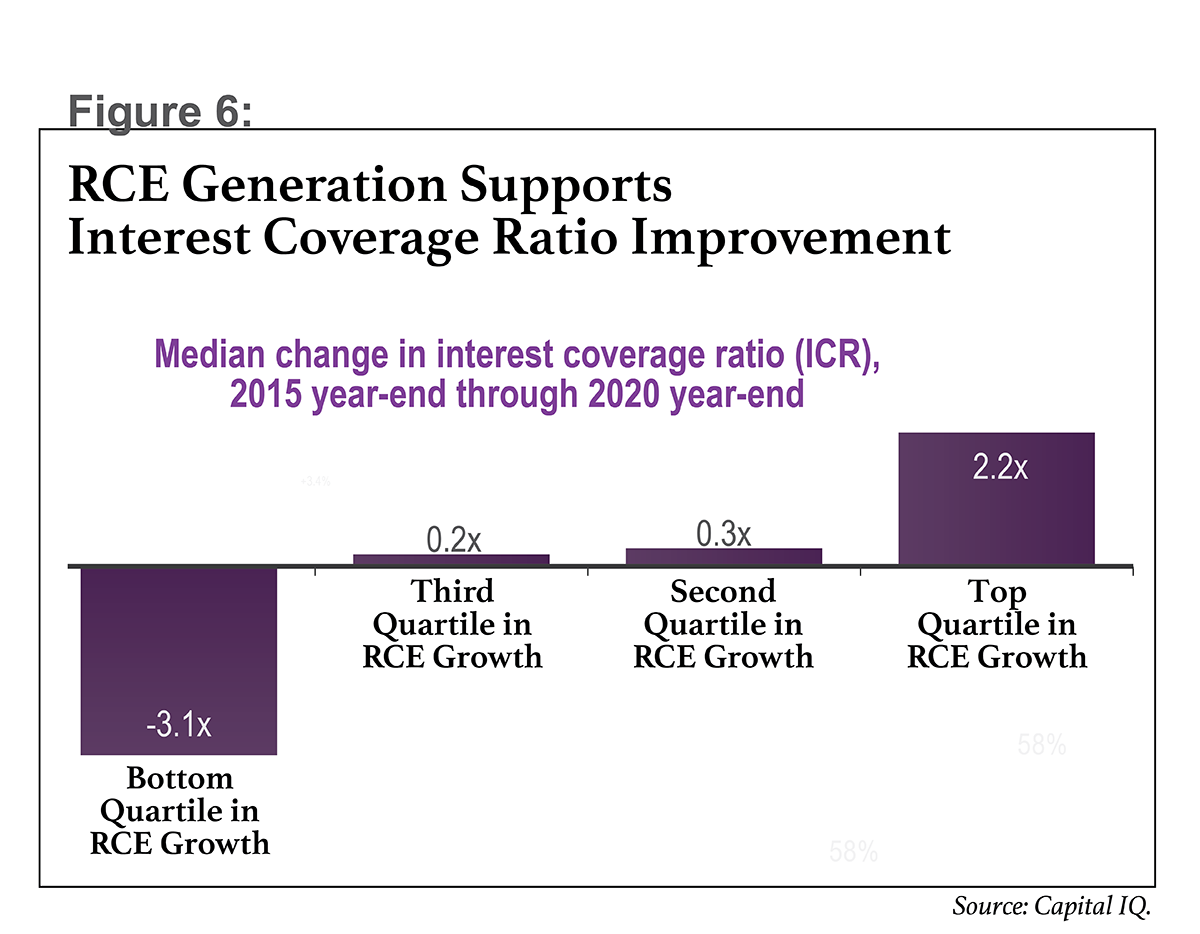
Lastly, we also looked at how RCE growth affected one of the most common corporate debt covenants and an important measure for treasury teams to track—the interest coverage ratio (ICR), which is the ratio of earnings (often measured as EBIT, EBITDA, or free cash flow) to annual interest expense. In this analysis, we specifically looked at EBITDA-less-capex as a proxy for free cash flow for the earnings component of this ratio.
For companies that achieved top-quartile RCE growth from 2016 through 2020, ICR increased by 2.2x. (See figure 6.) And the gap between top-quartile RCE performers and the rest of the pack is striking. Second- and third-quartile performers improved their interest coverage ratio by less than 0.3x, and bottom-quartile performers saw this ratio decrease 3.1x. Furthermore, companies that grew RCE were almost twice as likely to improve their ICR as to see it decline. Once again, RCE growth outperformed all other factors in the likelihood of improving this measure of solvency.
We also compared the impact of ICR improvements on TSR, versus RCE and the five tools of value creation. Companies that were top-quartile in ICR improvement were 2.3 times more likely to achieve top-quartile TSR than bottom-quartile TSR. This would place ICR improvement in fourth place among RCE growth and the five tools. This result supports our previous research on the subject, published in “Is Financial Leverage Good for Shareholders?” which showed that highly leveraged companies underperform their more solvent peers.
Why does RCE help explain solvency, in addition to TSR? The answer is the comprehensive nature of RCE, which strikes the balance between growth, margins, and capital productivity. Companies that grow RCE generate cash that outperforms all their invested capital. By supporting intrinsic value creation in the form of RCE growth, treasury teams can achieve a dual mandate of driving shareholder value and improving solvency through better leverage—and, potentially, better financing terms.
Planning for Value Creation
Understanding the metrics that best drive TSR will not only help treasury and finance professionals manage the cash flows of the business while facilitating long-term profitable growth, but also provide insights that can help define and communicate a company’s short- and long-term value creation strategy. Embracing comprehensive measures like RCE can better align the goals of corporate treasury to those of corporate strategy, and can enhance treasury’s ability to execute the company’s strategic goals.
This article was derived in part from insights from the “2021 Fortuna Advisors Value Creation Report.” We encourage those interested to read the full report and to reach out with any questions or comments.
