
In addition to investment decisions, a company’s cost of capital is frequently used as a key factor in corporate performance measurement and incentive design. For example, executives are often held accountable for delivering a Return on Capital (ROC) that exceeds their cost of capital. Alternatively, companies may use an economic profit model, which has been best popularized by Economic Value Added (EVA®1), which deducts an explicit capital charge against the net operating profit after tax (NOPAT) based on the capital employed multiplied by the cost of capital.
Given the importance of the cost of capital, it is no surprise that companies spend considerable resources, both internally and on external advisors, to calculate their cost of capital. Unfortunately, this process is not very simple. Put 10 experts in a room together and it is likely there will be 10 different answers for what the cost of capital is for a given company. Using a variety of different assumptions as inputs to the Capital Asset Pricing Model (CAPM), experts try to calculate a company’s Weighted Average Cost of Capital (WACC). Each expert seems to have their own approach.
However, despite the prevalence of using ROC and WACC by corporations in making strategic decisions, an analysis of the 1,000 largest companies between 2004 and 2011 shows a very weak relationship between these measures and how investors value companies.
As Figure 1 demonstrates, from the market’s perspective the relationship between ROC and WACC provides little correlation with actual market value. In fact, over this period of bull and bear markets, 84% of the observations are at a higher valuation than the ROC to WACC ratio would suggest and the median Enterprise Value as a multiple of Debt plus Equity was more than twice the ratio implied by the ROC to WACC ratio (represented by the diagonal ‘line of equivalence’).
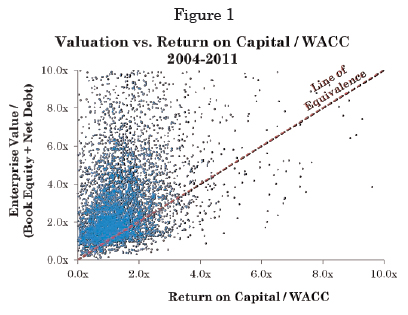
For companies using ROC compared to WACC as their hurdle for determining the value creation success of investments, they may be systematically understating the value contribution that an investment should be expected to have on actual enterprise value. This is critical as it may be leading many companies to mistakenly view positive value creating investments as value destroyers and in many cases may be falsely limiting the volume of productive investments in the future growth of the business.
A Better Way
To apply ROC to WACC in a way that better represents value creation, how can we determine the level of returns that are truly required by investors? We set out to develop an improved answer by comprehensively examining how investors actually value companies.
The product of our work is a newly developed and refined “Required Return” which can be used much like a traditional cost of capital or WACC, but which steps beyond the theory and improves the ability to explain valuations observed in the capital markets. This approach can improve strategy development, investment evaluation and performance measurement and management.
Our approach to determining the Required Return is based on three primary principles:
The Required Return should link operating performance to the market value of the company
The Required Return should be forward looking
The Required Return must fit within a performance measurement framework that encourages the right balance of growth and efficiency to create more value for shareholders.
I. Connecting Performance and Valuation
In order to connect operating performance to valuation, we must define a measure of profitability that correlates with the market’s assessment of value. Traditional measures, such as ROC, seem to have a poor relationship with market valuation as evidenced in Figure 2.
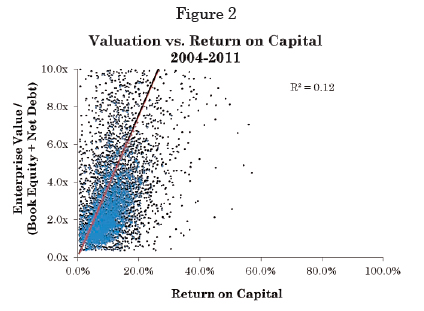
Return measures that rely on net book value tend to appear lower when assets are new and higher when they are old, and our research shows investors simply don’t value companies that way. What’s more, traditional return measures encourage managements to under-invest. The milking of old assets usually provides the false signal that value is being created as returns almost automatically rise when the assets depreciate away on the accounting ledger.
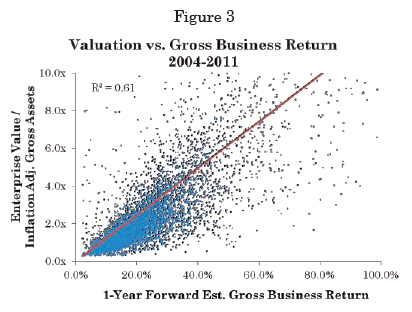
Gross Business Return was introduced as an improved version of return on capital in “Postmodern Corporate Finance” published in the Spring 2010 issue of Morgan Stanley’s Journal of Applied Corporate Finance. Gross Business Return divides the Gross Cash Earnings of a business by the Inflation Adjusted Gross Operating Assets.
Inflation Adjusted Gross Operating Assets is based on gross PP&E rather than net, which is the most important modification from traditional measures of return in terms of improving the correlation with capital market valuations. In fact, an estimate of accumulated inflation is added to better determine the current cost basis these assets represent. This is similar in concept to estimating a replacement cost but is more broadly applied to only account for general inflation.
To treat leased and owned assets more consistently, rent is capitalized using a simple 8x multiple (although a present value of future minimum lease commitments may be more appropriate for an individual company). To recognize research and development as the investment it is, the last five years of expenditures are accumulated as an asset, much like the buildup of capital expenditures into gross PP&E.
Finally, goodwill and intangibles are excluded from the calculation of Inflation Adjusted Operating Assets to ensure a focus on the relationship between operating performance and valuation. Since the value of goodwill does not need to be ‘maintained’ with any separate cost or expenditure not already captured in EBITDA or the operating assets, it is unnecessary to include in the calculation of returns. For certain companies however, this asset is material to either the invested capital base or future growth strategies and when appropriate, adjustments for its value can be included.
Gross Cash Earnings is designed to be consistent with this calculation of the asset base. Starting with earnings before interest, taxes, depreciation and amortization (EBITDA) less taxes, two adjustments are made to add back rent expense and research and development costs for consistency.
Each adjustment to the standard return measure was carefully tested to ensure it adequately improved the ability to explain how the market recognizes operating performance in determining value.
Dividing Gross Cash Earnings by Inflation Adjusted Operating Assets, we arrive to our profitability measure of Gross Business Returns that correlates much better to actual market values as shown in
II. Forward Looking Required Return
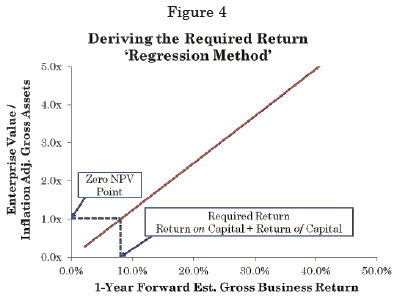
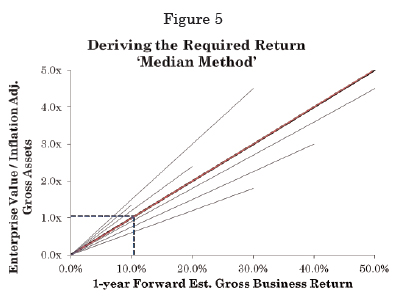
The Required Return is calibrated based on the relationship between current Enterprise Value and the forward Gross Business Return. Specifically, the Required Return assesses the level of Gross Business Return required to lead the market to set Enterprise Value to be equal to the Inflation Adjusted Gross Assets. This defines the Zero NPV Point as where these two values are equal, or the EV to GA ratio is 1.0x.
Companies that earn Gross Business Returns above the Required Return are typically worth more than their assets and have created value. Those with Gross Business Returns below the Required Return are usually worth less than their assets and have destroyed value.
One key difference between this Required Return and the traditional WACC is that this analysis of performance examines Cash Earnings relative to the Gross Assets and therefore the Required Return includes both a return of capital (i.e. Depreciation) and a return on capital (i.e. WACC).
When compared to the total ‘charge’ associated with depreciation plus WACC in the ROC to WACC relationship, this new approach demands a total ‘charge’ that is materially lower. This is a critical strategic insight as many investments look more value creating through this new lens which can have a powerful effect on the decisions management takes with regard to investments. Perhaps some companies should be investing more in their future but their analyses are too conservative to support these higher growth strategies.
In our original research2, we applied a linear regression using the 1,000 largest non-financial companies in the U.S. to determine the Required Return as the point at which the regression yielded an EV/GA ratio of 1.0x, as shown in Figure 4.
However, companies further away from the origin had a disproportionate influence on the regression and therefore the measured Required Return. Many of these companies in the upper right of the regression had high valuations which dragged the regression higher and steeper. The result in most periods was that approximately 2/3rds of the companies appeared to be ‘under-valued’, or trading at an EV to GA lower than that suggest by the regression.
Further testing showed that using a straight median of observed individual company Required Returns, as illustrated in Figure 5, provides a better and more balanced measure of the market’s Required Return for the typical company.
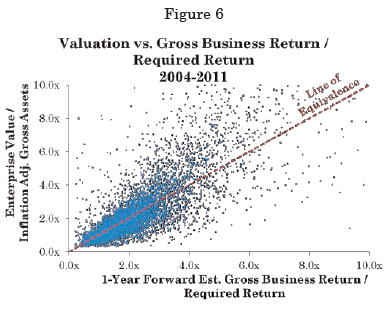
On average over the last 7 years, about half the companies trade above or below the line of equivalence drawn based on where the Enterprise Value to Gross Asset Ratio equals the relationship between the Gross Business Return and the Required Return, as shown in Figure 6. This demonstrates that this approach doesn’t show any bias toward over or under valuation given how the market is valuing companies at any given point in time.
To demonstrate how this Required Return can be utilized in valuation requires the introduction of an improved economic profit measure, Residual Cash Earnings (RCE). To calculate RCE, a capital charge, based on Inflated Gross Operating Assets multiplied by the Required Return, is subtracted from Gross Cash Earnings. Thus RCE shows the cash flow generated in excess of covering the capital charge. A valuation model that functions similar to discounted cash flow can be defined using RCE. The estimated Enterprise Value of a company is determined as the sum of the Inflated Gross Operating Assets plus the present value of expected future RCE.
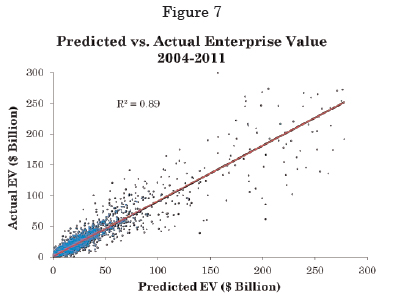
In reality, investors expect improvements or declines in RCE from most companies, but if we use a simplifying assumption that the near-term RCE is expected to be maintained, we can calculate a simple estimate of value for each company. As shown in Figure 7, this simple estimate of value correlates with actual market values quite well.
Critical Strategic Insights from the Market-Derived Required Return
Beyond tying operating performance to valuation better, there are other benefits and insights from this market derived Required Return. While not exhaustive, here are three examples that demonstrate the unique perspective of this approach:
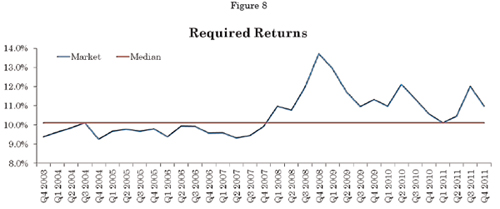
The market changes its demands for performance. The Required Return methodology is sensitive to changes in investor sentiment, as shown in Figure 8, and quantifies whether the market is above or below the ‘normal’ range better than many other market signal. Making investments when the Required Return is high can be the best time to make investments (or to repurchase shares) as the company is able to acquire cash flow when those cash flow streams are being discounted in the market. Additionally, understanding this change in the market’s demanded return can help managers understand when their operating performance does not reflect itself in the share price, relative to how the market is functioning at the time.
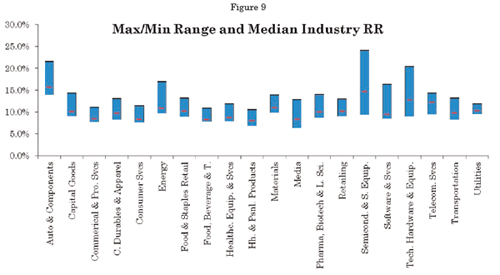
Industry effects matter. The standard Required Return methodology can be used to adjust for industry effects and define an Industry Required Return. There is a significant difference in Required Return between industry groups which should be factored into a company’s Required Return when establishing investment hurdles. Figure 9 shows the range of industry Required Returns observed over time.
Leverage has a minimal impact on the Required Return but a more significant impact on operating performance and growth. This methodology measures economic returns using after-tax EBITDA and includes the tax benefits of interest expenses resulting from leverage in the calculation of Gross Cash Earnings. Once the tax benefits are included, this research shows that the impact of leverage on observed Required Return and valuation is trivial across the whole market. Leverage should be considered based on the appropriateness for the industry’s operating characteristics and growth opportunities as leverage affects different industries in different ways.
Across all periods studied, the median Adjusted Debt/EBITDAR (including capitalized rent at 8x) is 2.2x. Of the 12 industries that carry higher leverage than this on average, the median Required Return is 10.3% compared to the 8 industries with less leverage that carry a median Required Return of 10.1%.
A closer look at the average performance of the companies in both groups reveals interesting strategic insights. The average Gross Business Return of companies with below median leverage is 24.9% versus 15.3% for the more highly levered group. Additionally, the companies with less leverage typically grow sales faster with the average projected sales growth over 2% higher at 8.6% versus the more highly levered group at 6.5%.
Leverage should be aligned with the growth and profitability opportunities available for the company. Based on the results above, increasing leverage may come at the expense of higher returns and investing in faster growth which are important factors for value creation over time.
III. Encouraging Value Creating Behavior
Most ROC versus WACC based measures, including all traditional forms of economic profit, tend to stifle reinvestment in the business and lead to lower future growth. This happens because companies often over emphasize improvement in rates of return, under recognize the value contributions of new investments, set hurdle rates systematically too high and they erroneously achieve higher returns by milking old assets and under investing
Many senior management teams are skeptical of long-term forecasts due to the uncertainty of the outcomes in future years. As a result, the near-term effect on accounting measures like ROC and economic profit (and EPS!) often override the NPV and IRR analysis which require longer-term assumptions about value. Combined, these three factors often act as a disincentive to grow and result in companies limiting the value they create.
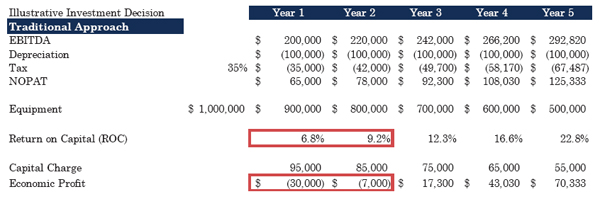
Consider the following illustrative example of an investment in a piece of equipment. The asset cost $1 million dollars and is expected to last 10 years. Over that time, the company is expected to deliver EBITDA of $200,000 in the first year, growing at 10%/year over the life of the asset. An IRR analysis of this project would suggest that the return from this investment is over 17% but would every company make this investment (the first five years of cash flow are shown above)?

Notice that the front-loaded capital charge and depreciation expenses cause the first two years of this investment to generate an ROC lower than WACC and, subsequently, contribute negative economic profit. In many companies, this would discourage the investment. While some companies may argue that they would make the investment at the executive level, it is often at lower levels in the organization where these types of decisions are first being considered and rejected before they are brought up for formal approval at the executive level.
By comparison, the RCEs generated from this project are positive immediately since the actual cash generated significantly exceeds the market’s Required Return. For a manager or executive considering this investment and focusing on maximizing the dollars of economic profit, the perspective provided by RCE would more likely result in a willingness to make this positive NPV investment. Simultaneously, RCE can be used in performance measurement to ensure the investment delivers results over time too.
Summary
The traditional ROC to WACC analysis performed by many companies can lead to overly pessimistic performance indications, erroneous investment analyses, inadequate investment in future growth and suboptimal value creation. This could be contributing to the inability of companies to create value and drive the stock market higher over the last decade or so. Companies can choose to embrace this new approach which provides a more realistic view of the value contribution of business activities.
Finding the right measure of performance and setting the appropriate hurdle rate to accept new investments is critical for developing and executing strategies that maximize value for shareholders. By establishing a measure of performance that accounts for the cost of capital without frontloading and overcharging for it, executives encourage more profitable new investments by connecting the operating performance to market value more effectively. Executives who embrace RCE and the Required Return can have greater confidence that achieved performance will have the desired impact on the company’s value over time.
An ‘all inclusive’ approach to making decisions, measuring performance, and understanding market value can become a powerful motivator in the organization and help overcome biases against reinvestment for growth while also building accountability for economic results.
Fortuna Advisors is committed to ongoing research for the benefit of our clients to help them drive better strategies to create maximum shareholder value over time. We are continuing our research into this topic to further isolate the return of capital and the return on capital to help our clients understand the different risks to their different business models. In addition, we will continue our research on the impact of other factors including growth, future improvements in efficiency, stability of returns, brands, and market position.
Gregory V. Milano is CEO and Co-Founder, Steven C. Treadwell is Partner, Jeffrey Routh is Senior Associate and Joseph Theriault is Associate of Fortuna Advisors LLC.
Notes:
1EVA® is a registered trademark of EVA Dimensions LLC
2”Post Modern Corporate Finance” – Morgan Stanley Journal of Applied Corporate Finance, Spring 2010
Notes for Figures/Charts:
Data for Figures 1-3 and 6 based on the 1,000 largest non-financial companies in the U.S. each year for fiscal years 2004-2011. Data provided by S&P Capital IQ and Fortuna Advisors.
1-year Forward Est. Gross Business Return in Figure 3 based on Fortuna Advisors’ estimates for Gross Cash Earnings and Inflation Adjusted Gross Assets based on 1-year forward consensus estimates for sales, EBITDA and capex provided by S&P Capital IQ.
Quarterly Required Return in Figure 8 based on Median Required Return for the 1,000 largest non-financial companies each quarter using methodology described
Industry RR in Figure 9 based on S&P Capital IQ Industry Codes and represent the Median Required Return for companies classified in each industry. Min/Max and Median based on the range of median RR for the quarterly observations between Q4, 2003 and Q4, 2011.
